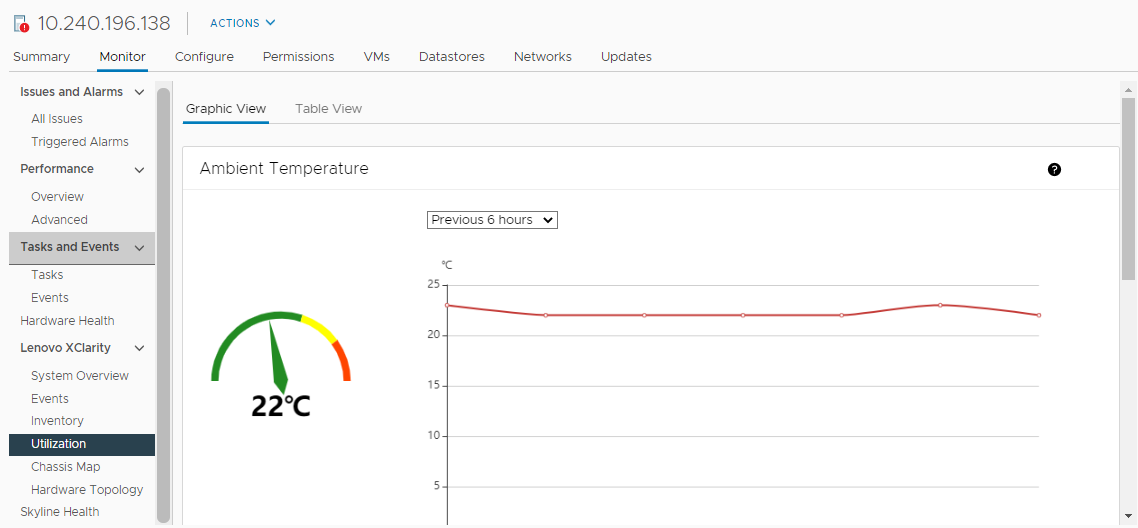
Viewing the server utilization
The Utilization page shows latest and history utilization information for ambient temperature, system power input, and fan speed.
To better display the information, this page provides two views for the information: graphic view and table view.
Figure 1. Utilization page
| Item | Latest information | History information |
|---|---|---|
| Ambient Temperature | Thermometer graph | Line graph/List (Previous 6, 12 or 24 hours) |
| Power Utilization | Doughnut graph | Line graph/List (Previous 1, 6, 12 or 24 hours) |
| Fan Speed | List | N/A |
Note
Fan Speed is only available in Table View.
Give documentation feedback