Using the Performance Capacity Used Breakdown chart for failover planning
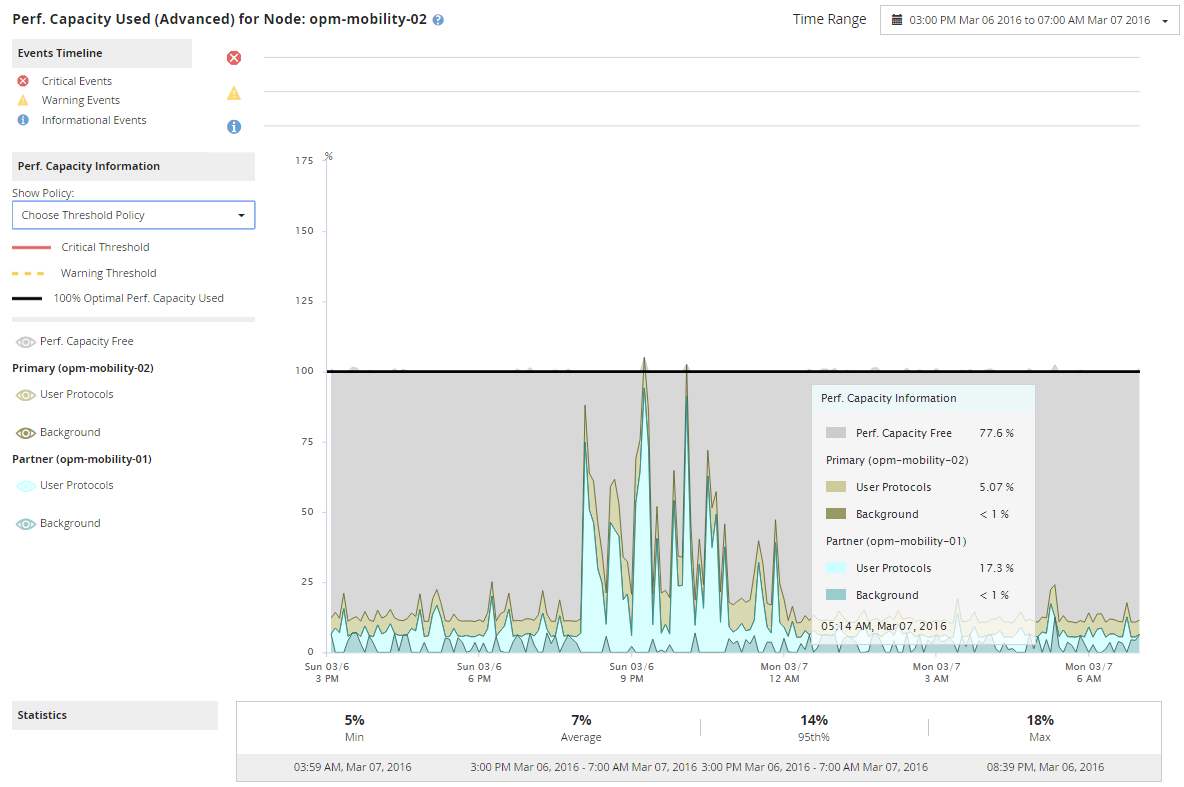
The detailed Performance Capacity Used - Breakdown chart shows the performance capacity used for the Primary node and the Partner node. It also shows the amount of free performance capacity on the Estimated Takeover node. This information helps you determine whether you might have a performance issue if the partner node fails.
In addition to showing the total performance capacity used for the nodes, the Breakdown chart breaks the values for each node into user protocols and background processes.
- User protocols are the I/O operations from user applications to and from the cluster.
- Background processes are the internal system processes involved with storage efficiency, data replication, and system health.
This additional level of detail enables you to determine whether a performance issue is caused by user application activity or background system processes, such as deduplication, RAID reconstruct, disk scrubbing, and SnapMirror copies.
- In the Perf. Capacity Used chart, select Breakdown and click Zoom View.The detailed chart for Perf. Capacity Used is displayed.
Give documentation feedback