Identifying and resolving a critical error
This procedure explains how to use Health Explorer to identify and resolve a critical error.
Procedure
- Double-click a state.By default, Health Explorer opens with all of the failed monitors in an expanded view.
The following figures provides an example of how an error might be displayed in Health Explorer.
Figure 1. Error displayed in Health Explorer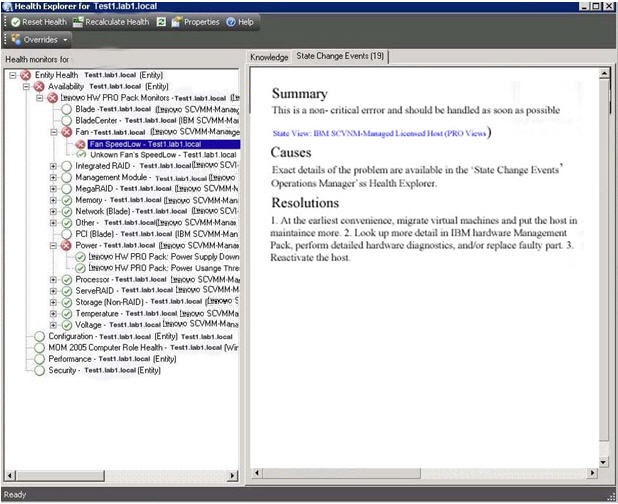 NoteIf there is no warning or critical alert, right-click the system in the
Lenovo SCVMM-Managed Licensed Hosts (PRO Views) and from the list, select Open and Health Explorer for system name. - In the right pane, click State Change Events to view details about the latest state change event that include the date and the time that the fan entered the error state.
You can also read details about the error.
Figure 2. Error details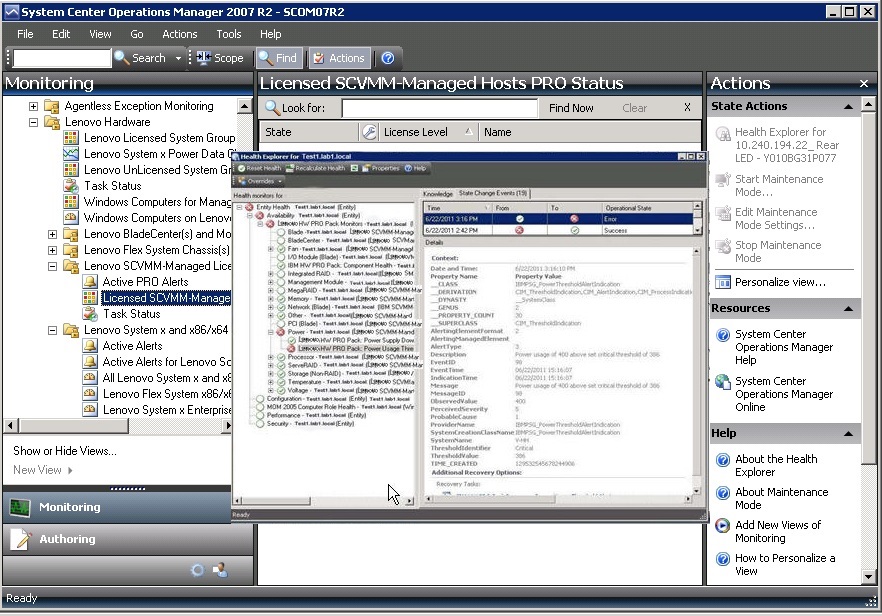
What to do next
You can find additional information in the IBM Knowledge pages. For instructions on how to access and use the IBM Knowledge pages, see the Lenovo Hardware Management Pack for Microsoft System Center Operations Manager Users Guide. This document can be viewed or downloaded from the Lenovo Hardware Management Pack for Microsoft System Center Operations Manager website.
Give documentation feedback