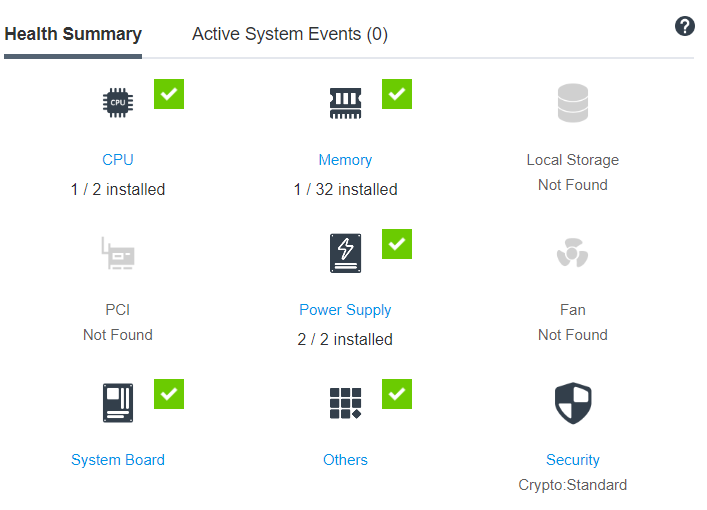
Viewing the Health Summary/Active System Events
Use the information in this topic to understand how to view the Health Summary/Active System Events.
CPU (Processor)
Memory
Local Storage
PCI Adapters
Power Supply
Fan
System Board
Others
Security

If any of the hardware components is not operating normally, it will be marked by a critical or warning icon. A critical condition is indicated by a red circle icon, while a warning condition is indicated by a yellow triangle icon. By hovering the mouse icon over the critical or warning sign, up to three currently active events for that component will be shown.

To view the other events, click the Active System Events tab. A window will appear showing the events that are currently active in the system. Click View all event logs to view the entire event history.
If the hardware component is marked by a green check mark, it is operating normally, and there are no active events.
The text underneath the hardware component states the number of components installed. If you click the text (link), you will be directed to the Inventory page.