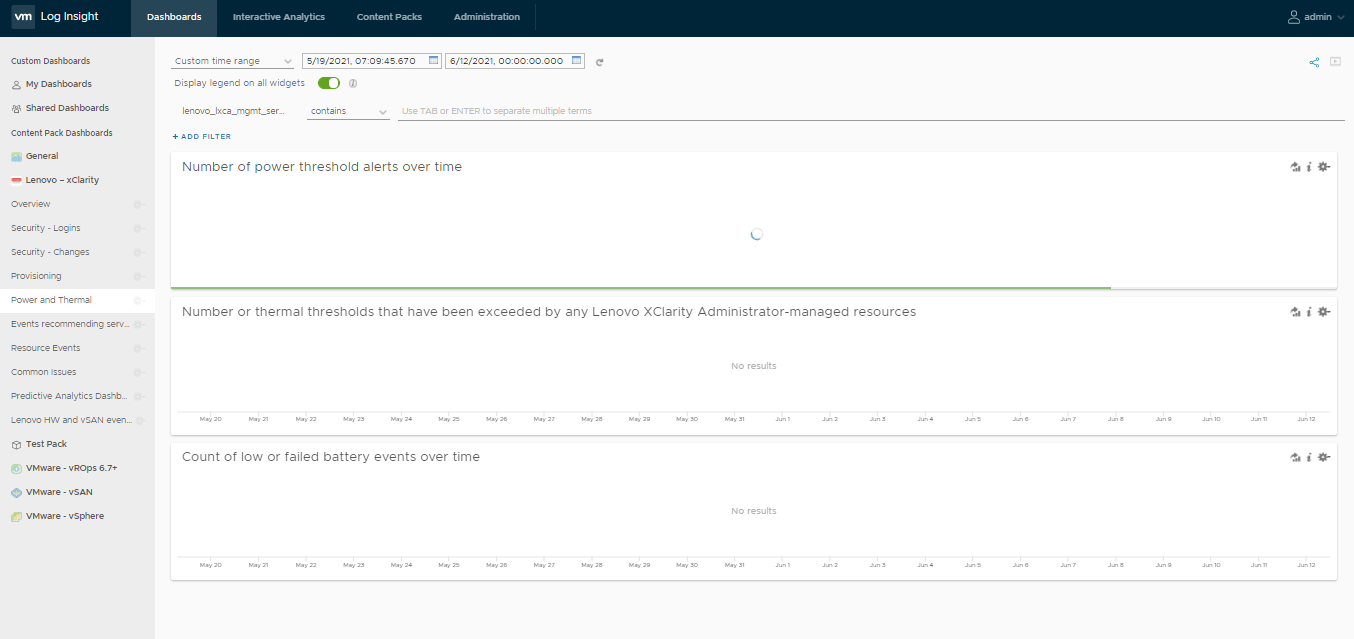
Power and Thermal Dashboard
Graphically depicts power/thermal thresholds. Any time power or thermal threshold is exceeded, the events associated with that situation are reflected in the graphs.
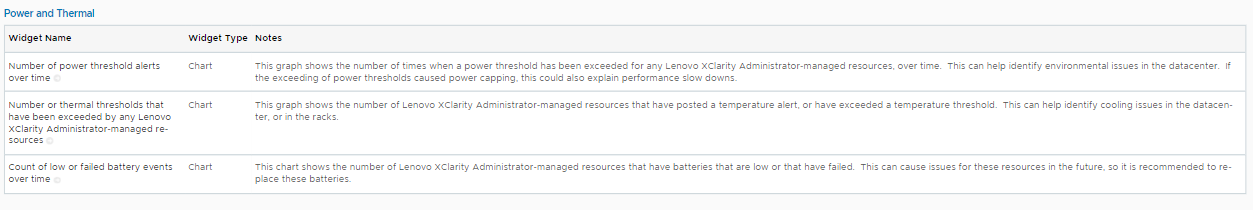
The following table lists the widget names and their details:
Give documentation feedback