Viewing the server health
Use the information in this topic to understand how to interpret server health icon indicators and what to do if a warning or error condition exist.
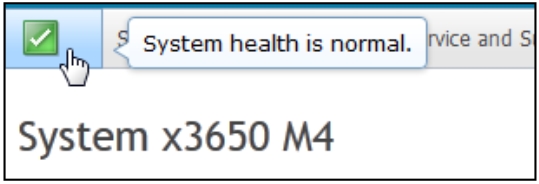
The server health is displayed under the title bar in the upper left corner of the System Status page and is designated by an icon. A green check mark indicates that the server hardware is operating normally. Move your cursor over the green checkmark to get a quick indication of the server health.
The following illustration is an example of a server in a normal mode of operation.
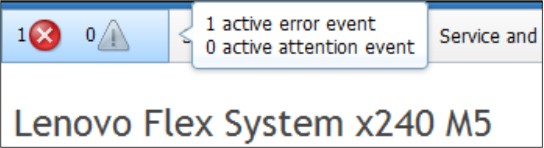
A yellow triangle icon indicates that a warning condition exists. A red circle icon indicates that an error condition exists.
The following illustration is an example of a server with active error events.
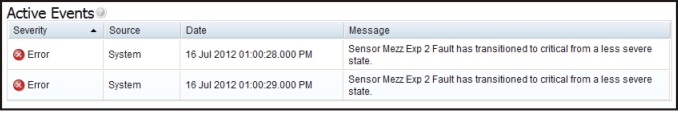
If a warning icon (yellow triangle) or error icon (red circle) is displayed, click the icon to display the corresponding events in the Active Events section of the System Status page.
The following illustration is an example of the Active Events section with error conditions.