Dashboards
The Lenovo XClarity Adapter management pack dashboards provide an overview of the performance and health of XClarity Administrator resources. The dashboards enable you to view, monitor, and troubleshoot resources
Dashboards provide a graphic representation of the status and relationships of selected objects. The standard dashboards are delivered as templates.
Before you begin
Log in to the vRealize Operations Manager UI using admin credentials.
From the vRealize Operations Manager main menu, select .
NoteFor V8.5 and earlier versions of vROps, from thevRealize Operations Manager main menu, select . The available dashboards are listed in the Lenovo XClarity folder. 
Procedure
To view the dashboards, click Dashboards.
To add Recents folder, in the right pane, select , and select the required dashboard. The required dashboard will be displayed in the Recents list.
From the Recents list, select the required dashboard.
The following dashboards are listed:
Lenovo XClarity Environment Overview
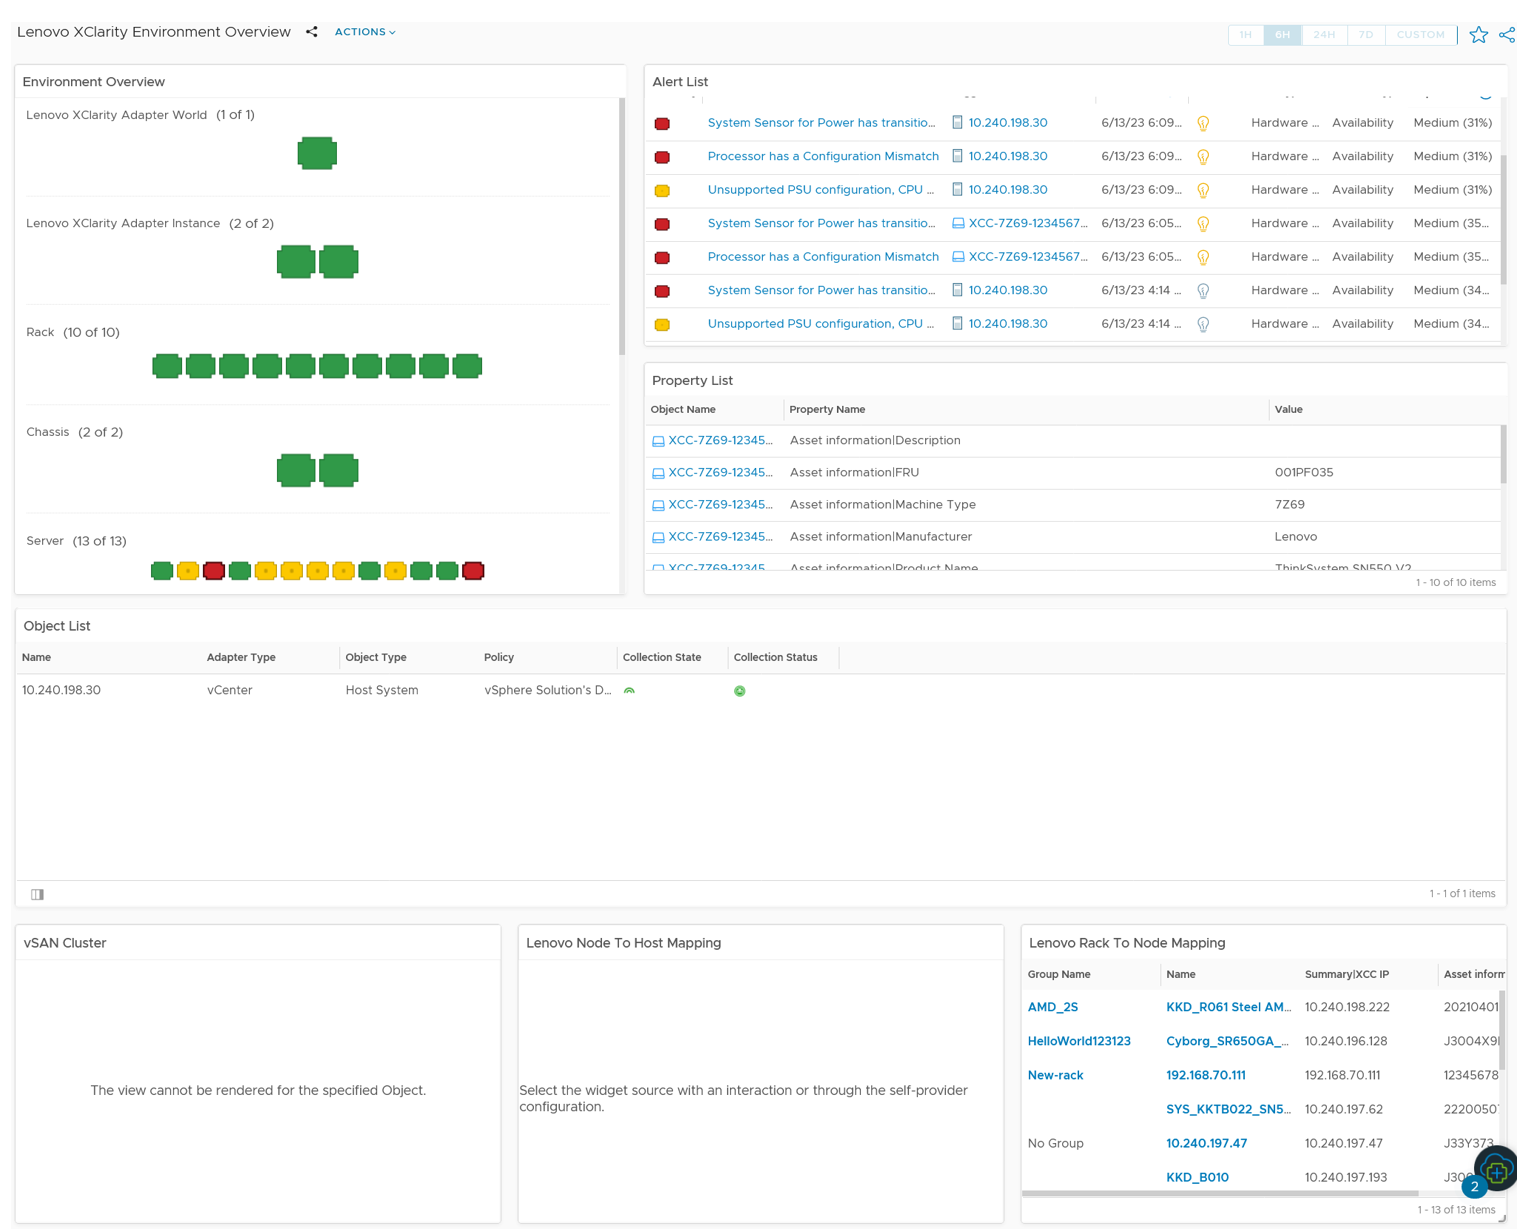
Widget Description Environment Overview Lists the resources and their health. Select the required resource to populate the related widgets. Alert List Lists the alerts of the resource selected in the Environment Overview widget. Property List Lists the details of the resource selected in the Environment Overview widget. Object List Lists the details of the object selected in the Environment Overview widget. It also displays the collection state and status of the resource. vSAN Cluster Lists the details of the vSAN cluster. Select a vSAN cluster to populate the related widgets. Lenovo Node to Host Mapping Lists the node to host mapping of the resource selected in the vSAN Cluster widget. Lenovo Rack to Node Mapping Lists the rack to node mapping details. Lenovo XClarity Power & Thermal Information
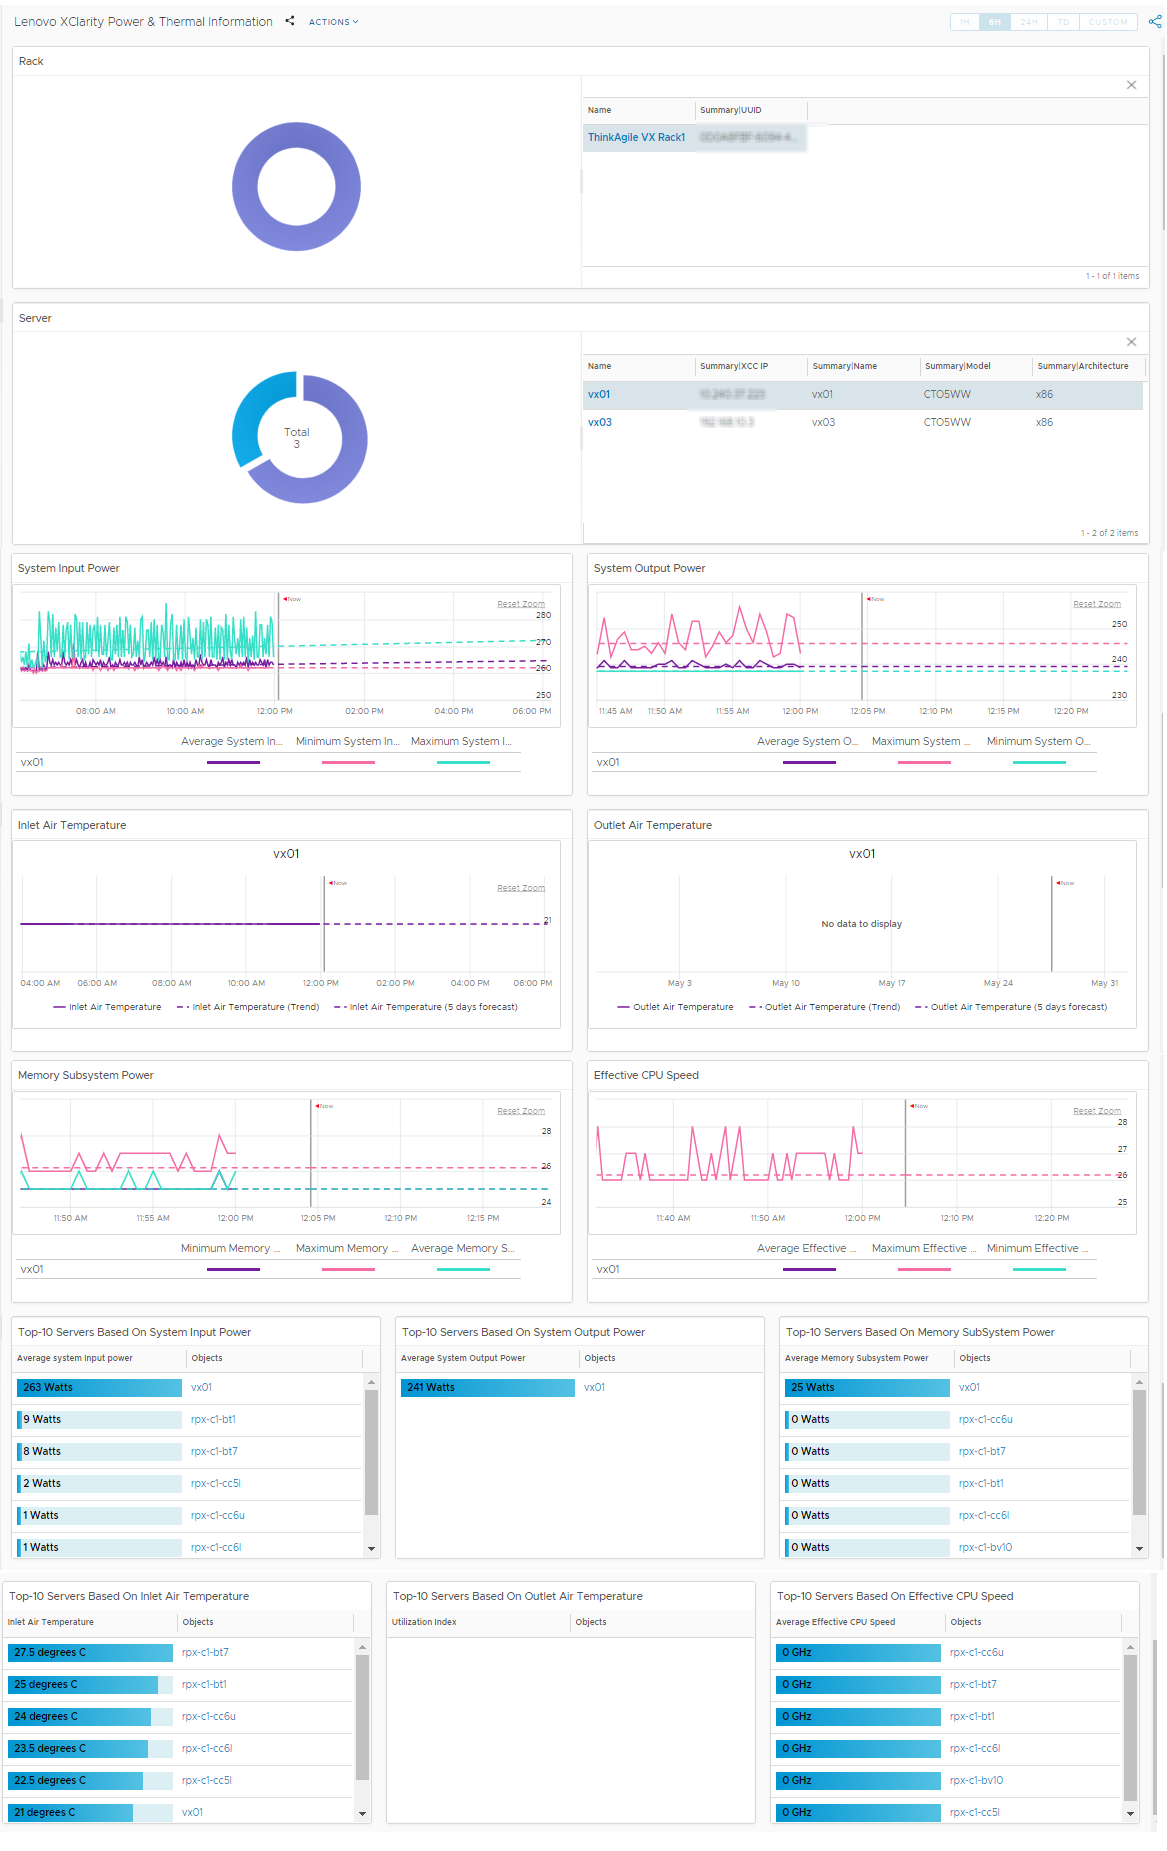
Widget Description Rack Lists the details and utilization of the rack. To view further details of a rack, click the rack on the pie chart. Select a rack to populate the related widgets. Server Lists the server details and utilization for the rack selected in the Rack widget. To view further details of a server, click the required server on the pie chart. Select a server to populate the related widgets. System Input Power Lists the system input power graphical details of the server selected in the Server widget. Hover over the graph to view further details. System Output Power Lists the system output power graphical details of the server selected in the Server widget. Hover over the graph to view further details. Inlet Air Temperature Lists the inlet air temperature to the time of the server selected in the Server widget. Hover over the graph to view further details. Outlet Air Temperature Lists the outlet air temperature to the time of the server selected in the Server widget. Hover over the graph to view further details. Memory Subsystem Power Lists the memory details. Effective CPU speed Lists the effective CPU speed. Top 10 servers based on system input power Lists the top 10 servers that have maximum system input power. Top 10 servers based on system output power Lists the top 10 servers that have maximum system output power. Top 10 servers based on memory subsystem power Lists the top 10 servers that have maximum utilized memory subsystem power. Top 10 servers based on inlet air temperature Lists the top 10 servers that have maximum inlet air temperature. Top 10 servers based on outlet air temperature Lists the top 10 servers that have maximum outlet air temperature. Top 10 servers based on effective CPU speed Lists the top 10 servers that have maximum CPU speed. Lenovo XClarity Topology
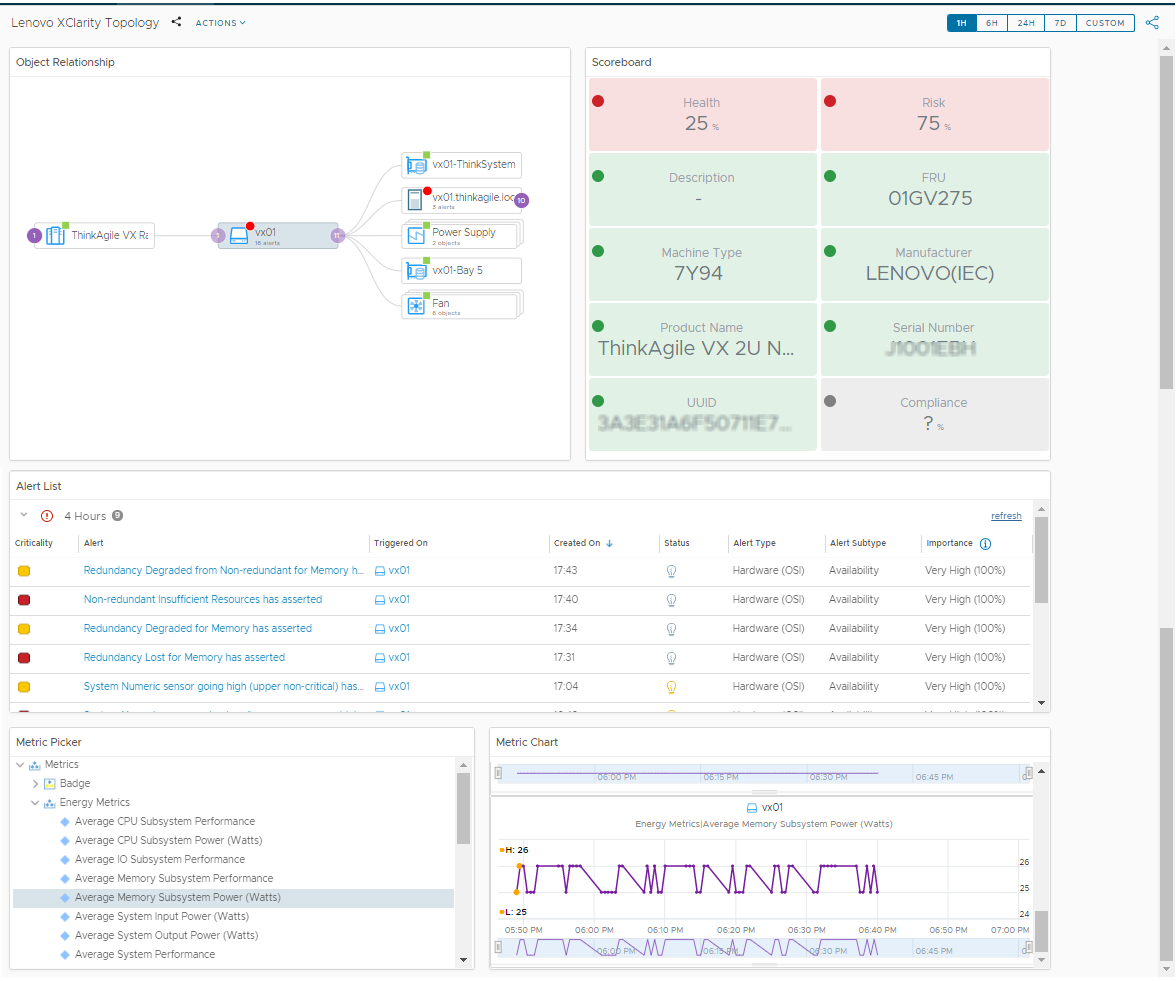
Widget Description Object Relationship Lists the relationship between the resources. Select the required object to populate the related widgets. Hover over the resource to view more details of the resource. Scoreboard Lists the details of the resource selected in the Object Relationship widget. Hover over the score to view more details. Alert List Lists the alerts of the selected resource. To view further details, click on the required alert to display the Alerts table. Metric Picker Navigate to the required metric and the selected metric details are listed in the adjacent Metric Chart widget. Metric Chart Lists the metric as selected in the Metric Picker widget. Lenovo XClarity Details
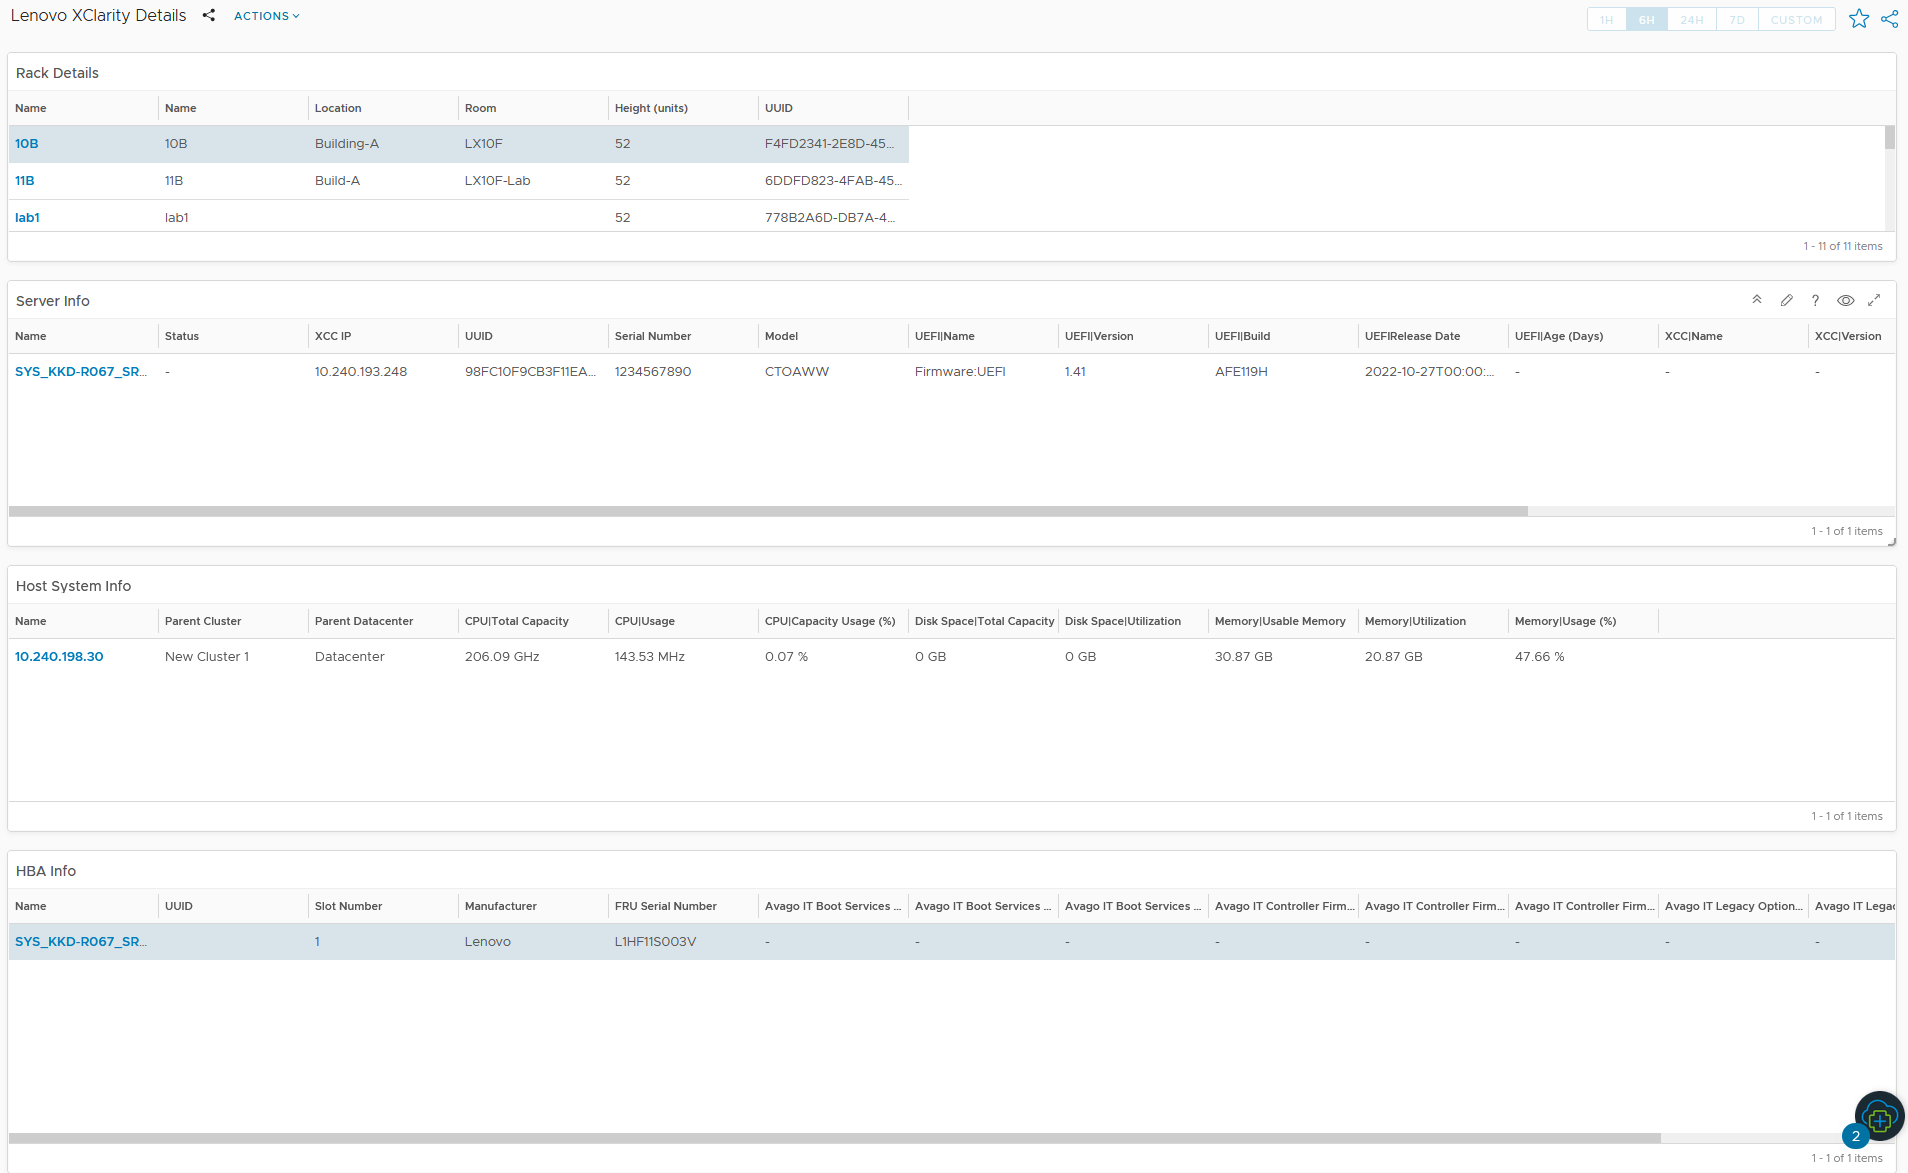
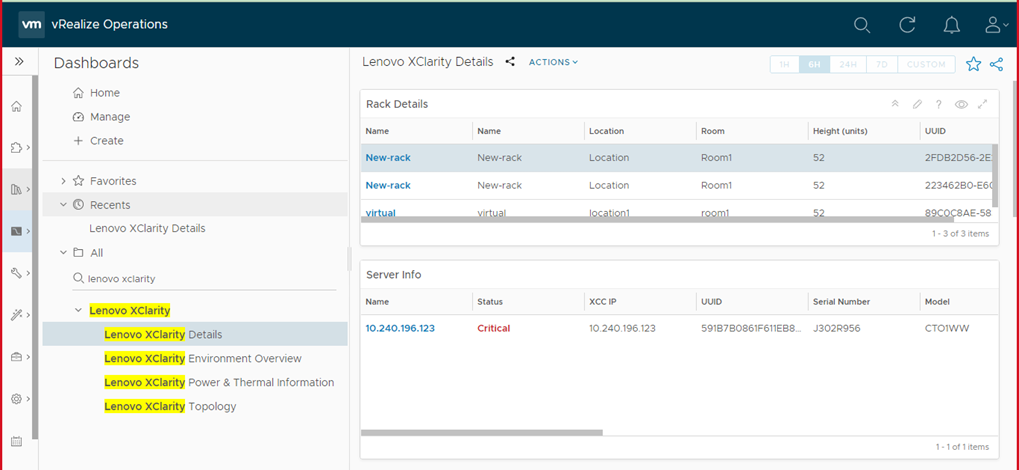
Widget Description Rack Details Lists the rack details. Select a rack to populate the details in related widgets. Server Info Lists the server details of the rack selected in the Rack widget. Host System Info Lists the host system details. HBA Info Lists the HBA details.