Viewing alerts
The alerts are fault events that are directly coming from LXCA. The alerts include a short description of the alert and recommendations.
The Lenovo XClarity Adapter Management Pack provides a set of pre-defined alerts and symptoms for resources that the Lenovo XClarity Adapter instance monitors.
The plugin helps to monitor the hardware events in a Lenovo XClarity Administrator-managed environment. Quickly identify trends based on hardware events received, including hardware failures, power/thermal thresholds that exceeded, and PFAs (predicted failure alerts). These events categorize by source, type of hardware surfacing the events, and whether service is required. This information can help identify issues in your data centers so that you can react before more serious issues occur.
Procedure
Log in to vROps as an admin user.
To view alerts of specific resources, click , and select the target resource.
Click the Alerts tab in the right pane to view the alerts of the selected resource.
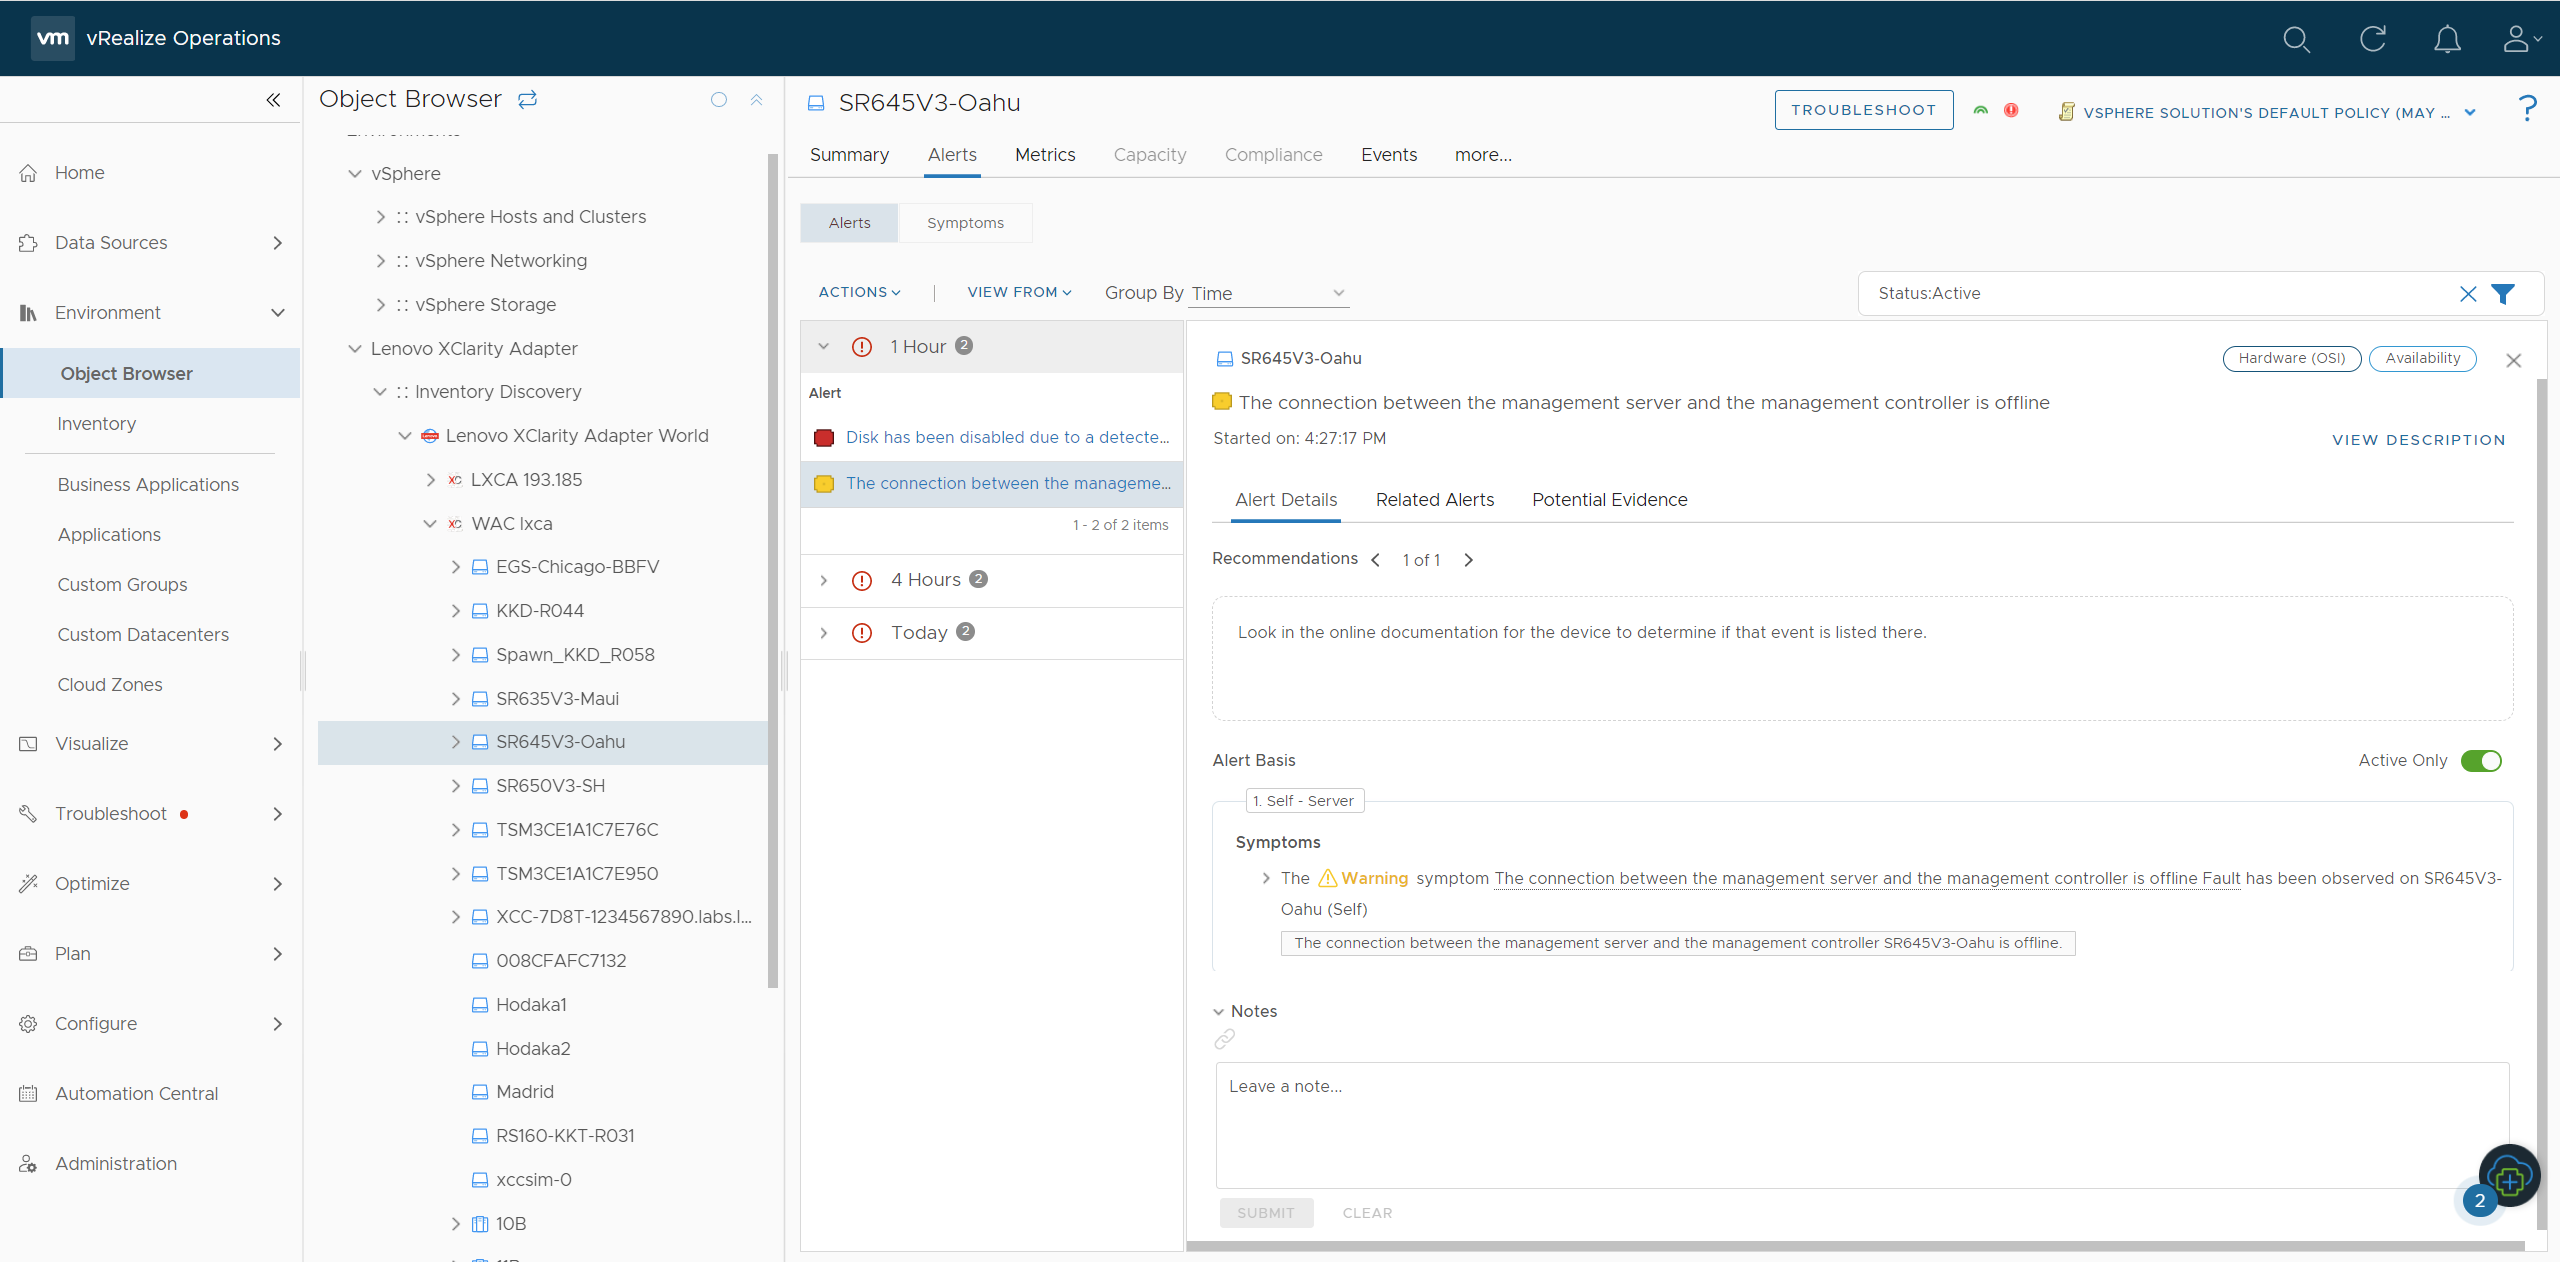
To view more details of each alert, click the alerts link to open the details in the right pane. For more details on Alerts, see VMware documentation.
Please note that if two or more alerts are triggered in LXCA with the same msgID and different commonEventIDs, then only one alert is triggered in vROps that is defined for the msgID. A common alert message is created by using an alert message from all alerts with the same msgID from LXCA.
For example; Alert message in vROps is displayed as follows:
[Alert 1 message] [Alert 2 message] [Alert 3 message] [… ] [… ]