Displaying the power performance
Use the information in this topic to display the power performance of the server.
Click the Performance tab to display the power performance information for the server. The Performance tab might not be available on all systems. The Chart and Table tabs show the compute utilization history and power performance for the following components:
- System
- Microprocessor
- Memory
- I/O
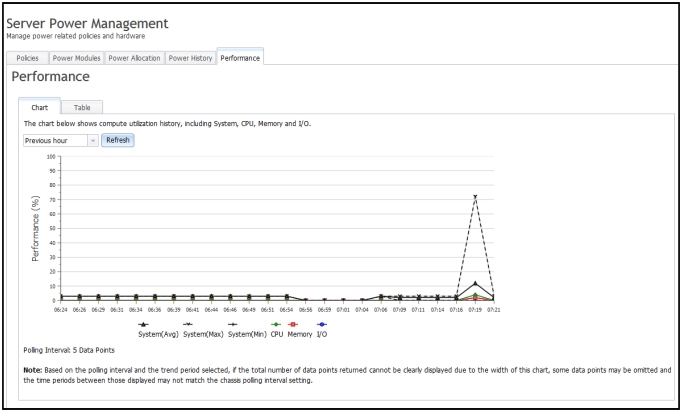
On the Chart tab select the Previous hour list to select the period of time to be displayed. Optional choices are the following:
- 1 hour
- 6 hours
- 12 hours
- 24 hours
Click the Refresh button to refresh the information simultaneously in the Chart and Table tabs. In the following illustration (for the Chart tab), the selected time is displayed horizontally (X-axis) and the performance (percentage) is displayed vertically (Y-axis) for the following performance indicators:
- System (Avg)
- System (Max)
- System (Min)
- Microprocessor
- Memory
- I/O
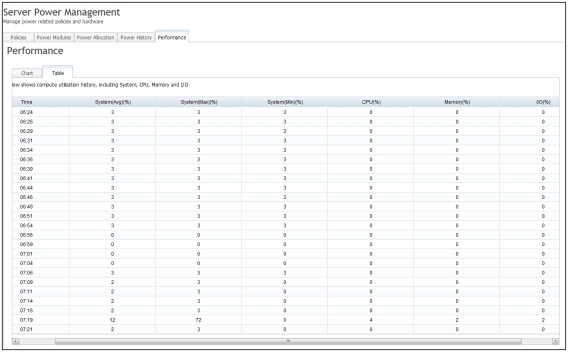
The Table tab displays the same performance indicators and information in a different format, as shown in the following illustration.
Give documentation feedback