Isolating problems from XClarity Administration
The Lenovo XClarity Administrator Dashboard displays the current status of all endpoints that are being managed and can be used to resolve issues that occur with the servers and any managed switches in your ThinkAgile SXM Series solution.
To check for issues, follow these steps:
Log in to the Lenovo XClarity Administrator interface.
From the Dashboard, click the icon or endpoint number to begin resolving issues for a server.
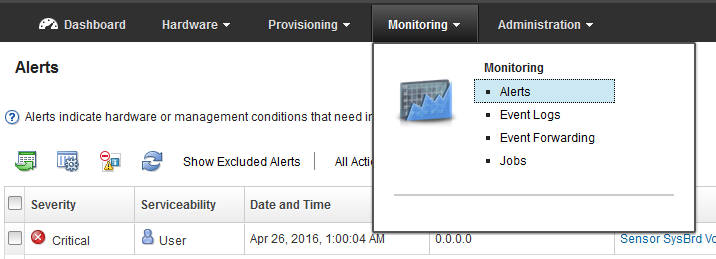
Click to view a list of all active alerts.
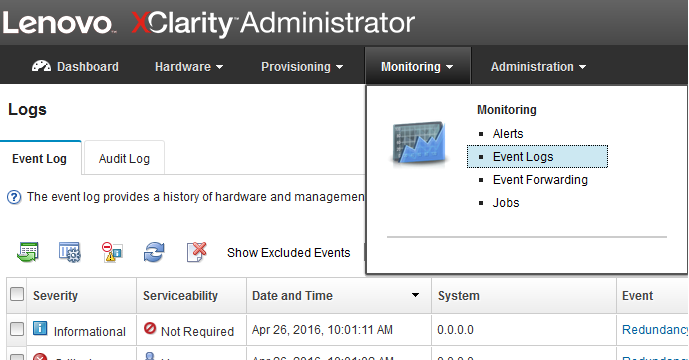
Click to view the event log.
Refer to the Lenovo XClarity Administrator documentation for more information. See ThinkAgile SXM Series documentation and related content for relevant links.
Collecting data
For information about collecting data that might be useful in issue resolution, see Collecting data.