Management-hub metrics and trends
You can monitor usage metrics for the management hub from the main dashboard. Metrics are graphically displayed on the Metrics panel.
Processors. Processor usage, as a percentage
Processor load. Processor load
Memory. Memory usage, as a percentage
Storage usage. Processor usage, as a percentage
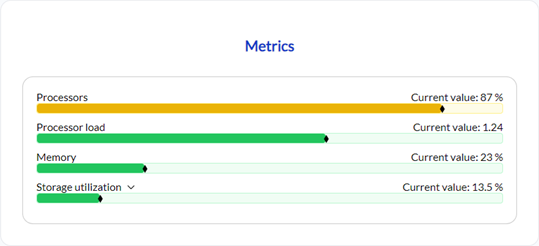
Current usage metrics
The Metrics panel shows the current usage (vivid color) and the amount available (pale color) for each component. Hover over the bar for each component to view more usage details.
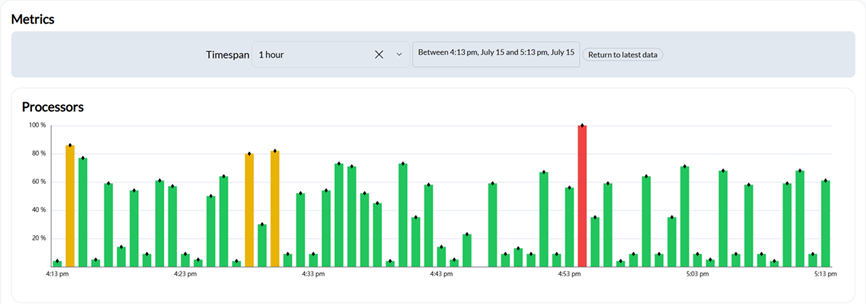
Historical usage metrics
Click the last hour link in Metrics panel to display the Metrics page that has charts showing with usage metrics over the last hour for each device component. Hover over any bar in the chart to view more usage details. Click Return to latest data to refresh the charts with current data.