Monitoring events in the audit log
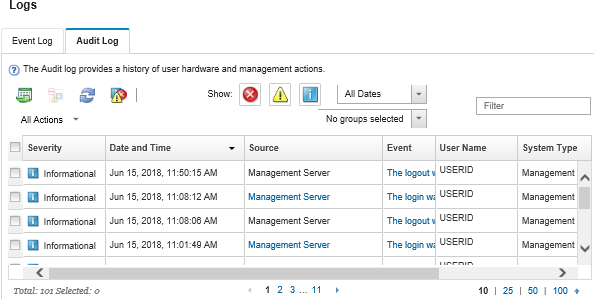
The audit log provides a historical record of user actions, such as logging in to Lenovo XClarity Administrator, creating a new user, and changing a user password. You can use the audit log to track and document authentication and controls in IT systems.
About this task
The audit log can contain a maximum of 50,000 events. When the maximum size is reached, the oldest event in the log is discarded and the new event is added to the log.
XClarity Administrator sends an event when the audit log reaches 80% of the maximum size and another event when the sum of the event and audit logs reaches 100% of the maximum size.
Procedure
To view the audit log, click from the XClarity Administrator menu bar, and click the Audit Log tab. The Audit Log page is displayed.

To view information about a specific audit event, click the link in the Event column. A dialog is displayed with information about the properties for the device that sent the event, details about the event, and recovery actions.
Results
View the source of the audit event by clicking the link in the Source column.
- Refresh the list of audit events by clicking the Refresh icon (
 ).TipThe event log refreshes automatically every 30 seconds if new events are detected.
 - View details about a specific audit event by clicking the link in the Event column and then clicking the Details tab.
- Export the audit log by clicking the Export as CSV icon (
 ).NoteThe timestamps in the exported log use the local time that is specified by the web browser.
 - Exclude specific audit events from all pages on which events are displayed (see Excluding events).
- Narrow the list of audit events that are displayed on the current page:
- Show or hide events of a specific severity by clicking the following icons:
- Critical events icon (
 )
) - Warning events icon (
 )
) - Informational events icon (
 )
)
- Critical events icon (
- Show only events with a specific date and time. You can choose one of the following options from the drop-down list:
- All Dates
- Previous 2 hours
- Previous 24 hours
- Past Week
- Past Month
- Custom
TipIf you selectCustom, you can filter hardware and management events that were raised between a custom start date and the current date. - List only events that contain specific text by entering the text in the Filter field.
- Sort the events by column by clicking on a column heading.
- Show or hide events of a specific severity by clicking the following icons: