Monitoring events in the event log
The event log provides a historical list of all hardware and management events.
About this task
The event log contains informational and non-informational events. The number of each of these events varies until the maximum of 50,000 events is reached in the event log. At that point, there is a maximum of 25,000 informational and 25,000 non-information events. For example, there are 0 events in the event log initially. Assume events are received so that 20,000 informational events and 30,000 non-informational events are received. When the next event is received, the oldest informational event is discarded even if a non-informational event is older. Eventually, the log balances out so that there are 25,000 of each type of event.
Lenovo XClarity Administrator sends an event when the event log reaches 80% of the minimum size and another event when the sum of the event and audit logs reaches 100% of the maximum size.
Procedure
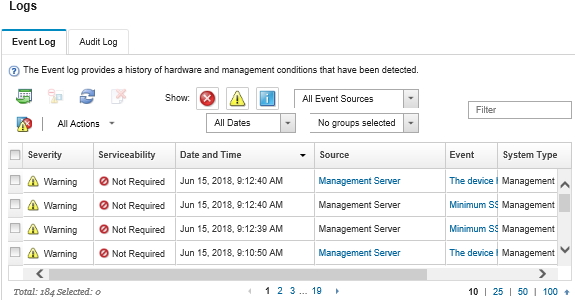
To view the event log, click from the Lenovo XClarity Administrator menu bar, and click the Event Log tab. The Event Log page is displayed.

Not required. The event is informational and does not require service.
User. Take appropriate recovery action to resolve the issue.
To view information about a specific event, click the link in the Event column. A dialog is displayed with information about the properties for the device that sent the event, details about the event, and recovery actions.
Support. If Call Home is enabled on Lenovo XClarity Administrator, the event is typically submitted to Lenovo Support Center unless an open service ticket for the same event ID already exists for the device.
If Call Home is not enabled, it is recommended that you manually open a service ticket to resolve the issue (see Submitting a service request for hardware issues to the Lenovo Support Center).
Results
View the source of the event by clicking the link in the Source column.
Refresh the list of events by clicking the Refresh icon (
 ).TipThe event log refreshes automatically every 30 seconds if new events are detected.
Clear all events in the event log by selecting .
- View details about a specific event by clicking the link in the Event column and clicking the Details tab.
Export the event log by clicking the Export as CSV icon (
 ).NoteThe timestamps in the exported log use the local time that is specified by the web browser.
- Exclude specific events from all pages on which events are displayed (see Excluding events).
- Narrow the list of hardware and management events that are displayed on the current page:
- Show or hide events of a specific severity by clicking the following icons from the drop-down list:
- Critical events icon (
 )
) - Warning events icon (
 )
) - Informational events icon (
 )
)
- Critical events icon (
- Show only events from specific sources. You can choose one of the following options from the drop-down list:
- All Alert Sources
- Hardware Events
- Management Events
- Serviceable Events
- Customer Serviceable Events
- Non-serviceable Events
- Show only events with a specific date and time. You can choose one of the following options:
- All Dates
- Previous 2 hours
- Previous 24 hours
- Past Week
- Past Month
- Custom
TipIf you selectCustom, you can filter hardware and management events that were raised between a custom start date and the current date. - List only events that contain specific text by entering the text in the Filter field.
- Sort the events by column by clicking on a column heading.
- Show or hide events of a specific severity by clicking the following icons from the drop-down list: