Infrastructure admin and infrastructure viewer users can view metrics about a compute node, such as CPU usage, memory usage, and network activity.
Complete the following steps to view compute node metrics.
- Log in to the ThinkAgile CP Cloud Controller as an Infrastructure admin or an infrastructure viewer user.
- In the left navigation, expand Resources and click Hardware to display the Hardware Stack page.
- Scroll down to the Compute Block section and click the compute node for which you want to see details.
Figure 1. Compute node properties on the Hardware Stack page 
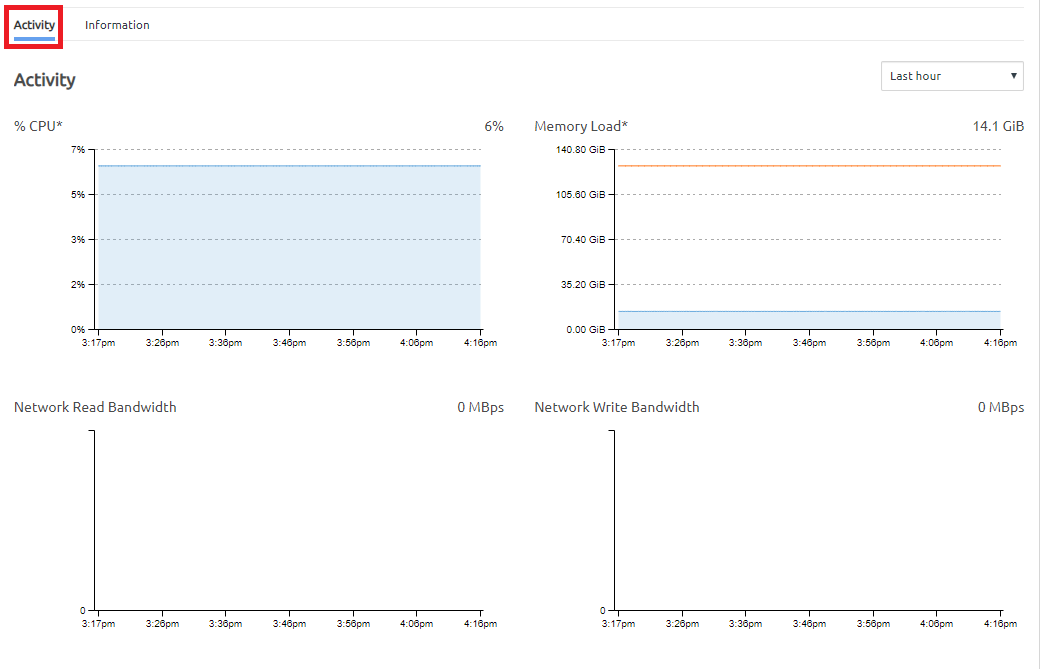
- The Activity tab shows the metrics that are available.
Figure 2. Activity tab on compute node details page 
On the Activity tab, the following charts are displayed:
%CPU. Displays the average CPU utilization of the compute node, including hypervisor usage.
Memory Load. Displays data currently held in memory by running and paused instances on the compute node, as well as hypervisor usage.
Network Read Bandwidth. The amount of data received (in MBps) from the network.
Network Write Bandwidth. The amount of data transmitted (in MBps) to the network.
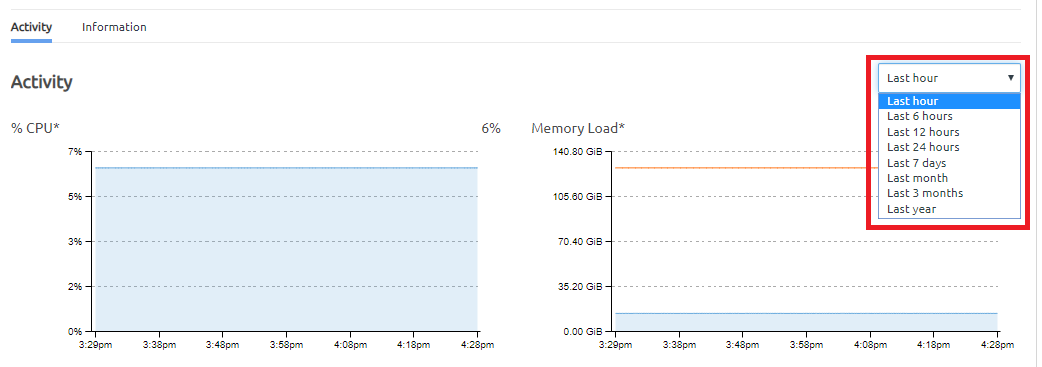
You can choose to display this activity over different time frames ranging from the last hour to the last year.
Figure 3. Compute node metrics timeframes 
CPU and RAM allocation are currently used to determine how instances are distributed to compute nodes. The underlying algorithm used by the engine is shown below. The output of the algorithm is the compute allocation factor, which indicates how available a compute node is to run the instance; a compute node with the lowest allocation factor will be selected to run the instance.
Application instances can be manually placed on a particular compute node by using compute categories and tags. For information about categories and tags, see the following topic:
Manage categories and tags


