Monitoring active alerts
Alerts are hardware or orchestrator event that require investigation and user action. Lenovo XClarity Orchestrator polls the resource managers asynchronously and displays alerts that are received from those managers.
About this task
There is no limit to the number of active alerts that are stored in the local repository.
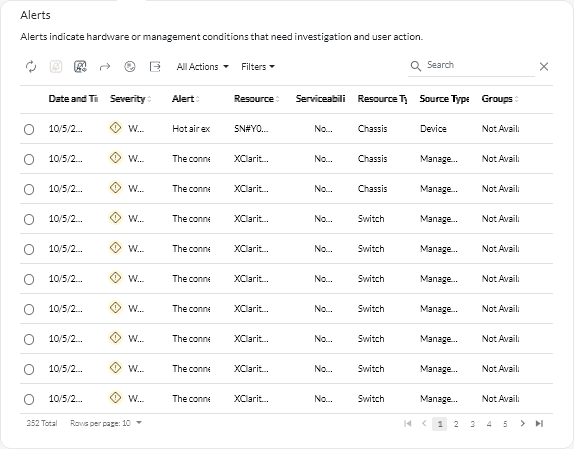
From the Alerts card, you can view a list of all active alerts.

The Severity column identifies the severity of the alert. The following severities are used.
- (
) Informational. No action is required.
- (
) Warning. Action can be deferred, or no action is required.
- (
) Critical. Immediate action is required.
The Serviceability column identifies whether the device requires service and who typically performs that service. The following serviceability types are used.
- None. The alert is informational and does not require service.
- (
) User. Take appropriate recovery action to resolve the issue.
- (
 ) Support. If Call Home is enabled for XClarity Orchestrator or for the resource manager that manages the associated device, the alert is typically submitted to Lenovo Support Center unless an open service ticket for the same alert ID already exists for the device (see Automatically opening service tickets using Call Home).
If Call Home is not enabled, it is recommended that you manually open a service ticket to resolve the issue (see Manually opening a service ticket in the Lenovo Support Center).
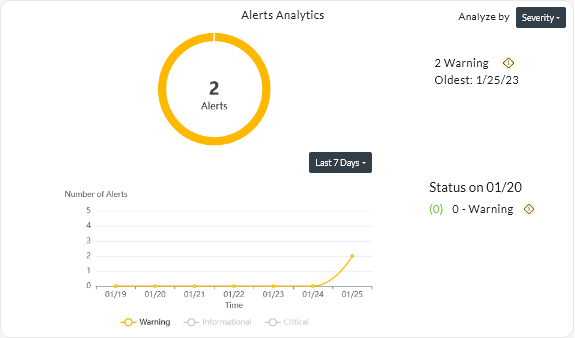
If active alerts exist, alert statistics are displayed in the Alerts Analytics card. You can view alert statistics by severity, source, resource, and serviceability for the current day and over a specific period of time (see Analyzing active alerts).

Procedure
To view active alerts, complete one or more of the following steps.
- View all active alerts
Click from the XClarity Orchestrator menu bar to display the Alerts card.
To view information about a specific alert, click the description in the Alert column. A pop-up is displayed with information about the source of the alert, explanation, and recovery actions.
- View active alerts for a specific device
- From the XClarity Orchestrator menu bar, click Resources (
 ) and then click the device type to display a card with a tabular view of all managed devices of that type.
 - Click the row for a device to display the device summary cards for that device.
- Click Alerts Log to display the list of active alerts for the device on the Alerts Analytics card.
To view information about a specific alert, click the description in the Alert column. A pop-up is displayed with information about the source of the alert, explanation, and recovery actions.
- From the XClarity Orchestrator menu bar, click Resources (