The Dashboard shows a list of current reports in the Metering Manager. Follow these steps to view the Metering Manager Dashboard.
- Click Dashboard in the top navigation menu.
Figure 1. Click Dashboard 
The Dashboard shows a list of all reports currently available.
Figure 2. Metering Manager Dashboard 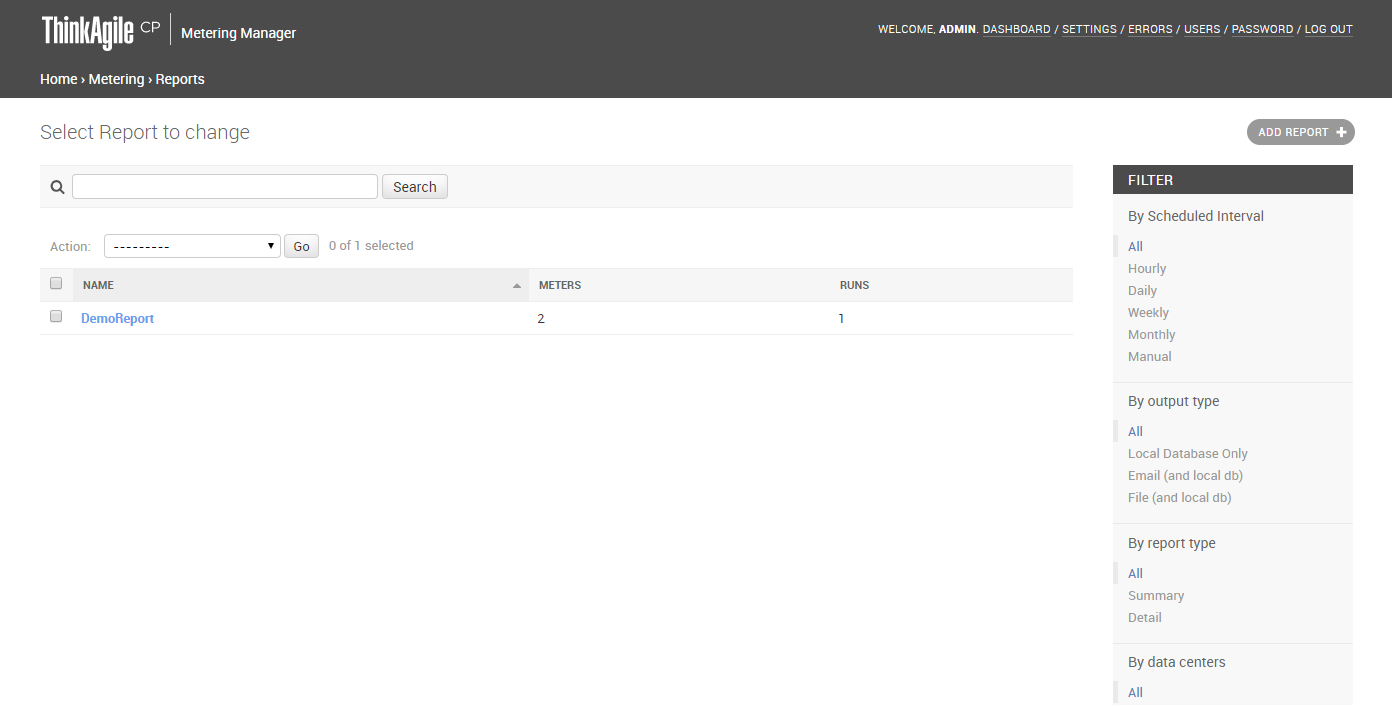
- In the Search field, you can enter text and click Search to search the list of reports.
- Under Filter, you can filter the list of reports by selecting one of the following filters:
Scheduled time interval – All, Hourly, Daily, Weekly, Monthly, or Manual (if you configured a manual time interval)
Output type – Select All, local database or email
Report type – Select All, Summary or Detail
Data Center – Select a specific Virtual Data Center to view reports for applications in that data center
- Select a report in the list to view and change report details.