Activity
This section covers the information displayed under the Activity tab of the Metering Manager.
CPU, Memory and Network Statistics
The first section of the Activity tab displays statistics regarding the CPU load, memory load, and network read and write bandwidths. These statistics can be viewed for several time periods:
Last hour
Last 6 hours
Last 12 hours
Last 24 hours
Last 7 days
Last month
Last 3 months
Last year
Figure 1. CPU, Memory and Network Usage Statistics 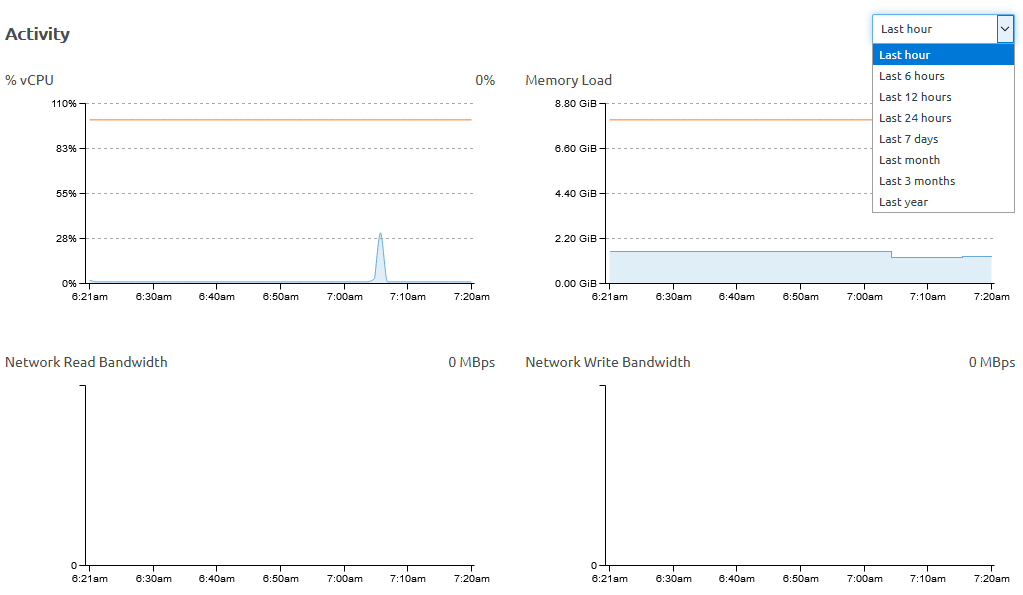
Storage Statistics
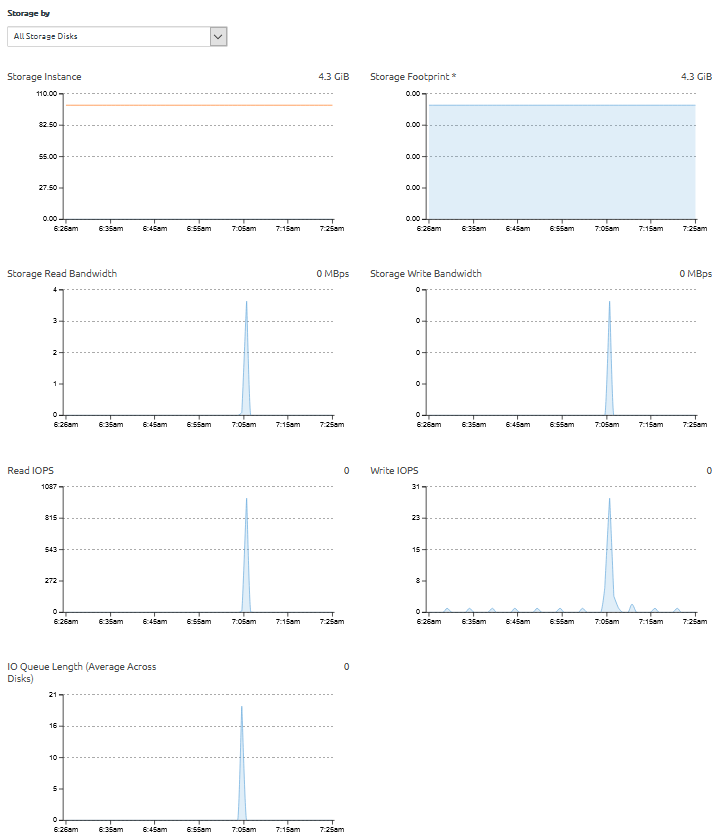
The second section of the Activity tab displays statistics regarding storage usage. These statistics include the following:
Storage Instance
Storage Footprint
Storage Read Bandwidth
Storage Write Bandwidth
Read IOPS
Write IOPS
IO Queue Length (Average Across Disks)
You can select a specific storage disk from the drop-down menu.
Figure 2. Storage Statistics
Give feedback