Complete these steps to modify a Metering Manager report.
- From the Dashboard page, select a report from the list. The Report page opens.
- Click Edit at the top right of the page.
Figure 1. Edit a report 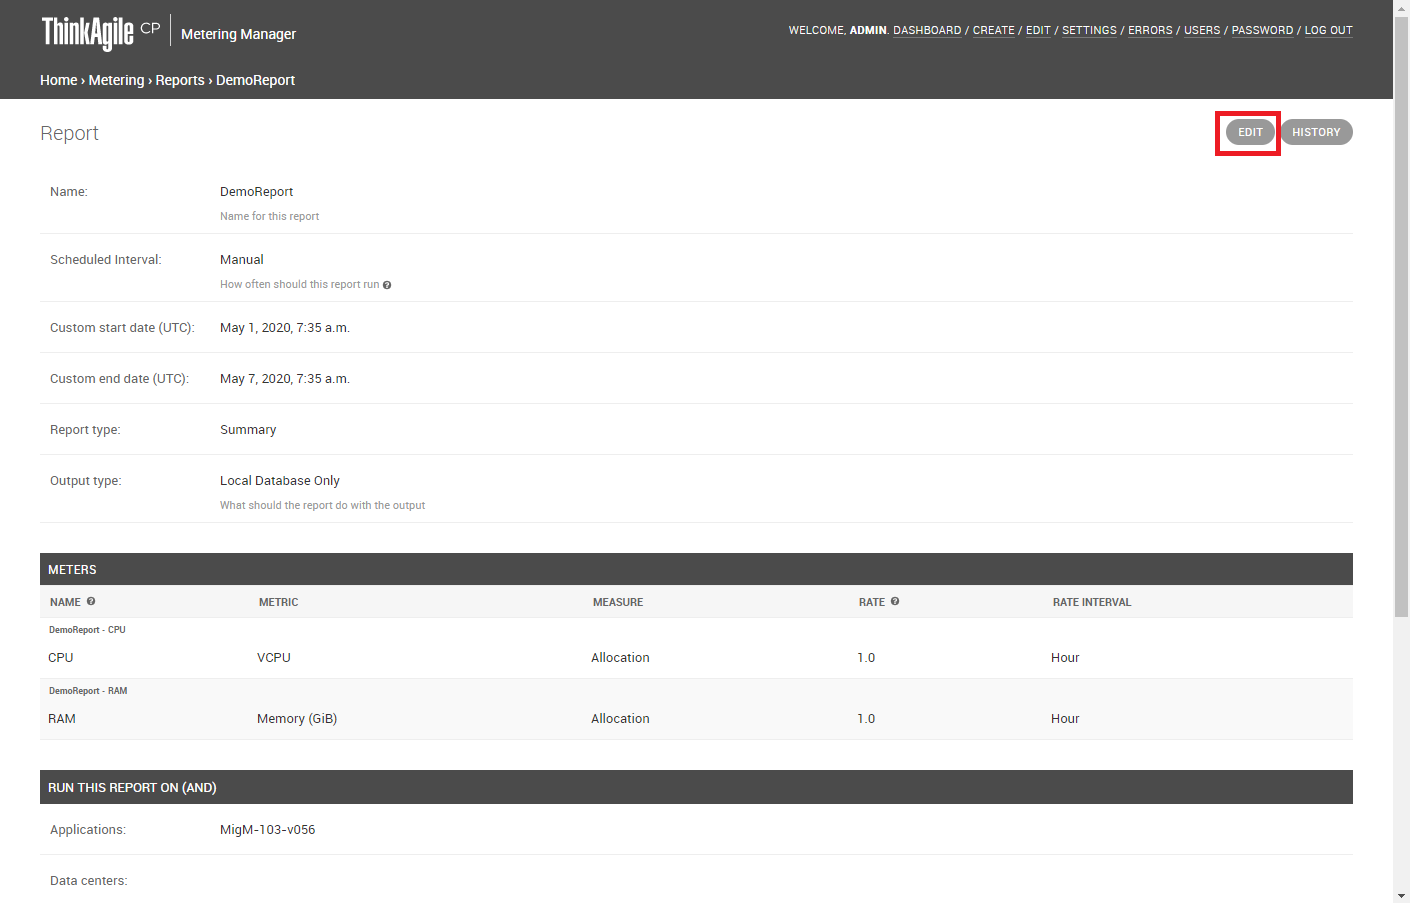
- Enter a new name in the Name field to change the name of the report.
- To modify the Scheduled Interval, select one of the following scheduled time intervals for when you want the report to run.
Hourly – This report captures data from the start of the previous hour to the start of the most recent hour. For example, if the report runs at any time between 10:00 a.m. and 10:59 a.m. inclusive, the results will show data from 9:00 a.m. to 10:00 a.m.
Daily – Select the hour of the day to run the report. This report captures data for the previous day regardless of when you run the report.
Weekly – Select the day of the week and the time of day to run the report. Captures data for the previous week regardless of the day you run the report.
Monthly – Select the day of the month and the hour of the day to run the report. This report captures data for the previous month regardless of the day you run the report.
Manual – Select a custom start date and time and a custom end date and time. This report captures data for the custom defined interval.
Figure 2. Define a custom interval for the report 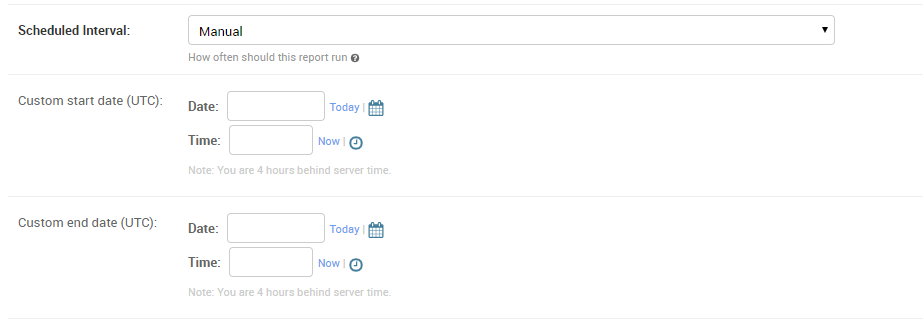
- To change the Report Type, select one of the following:
- To change the Output Type, select one of the following:
Local Database Only – The report runs are stored on the local database for the Metering Manager application.
Email and Local Database – In addition to being stored in the local database, you will be prompted to enter an e-mail address to which the report runs will be sent.
- To change a meter in the report, modify the following information as needed:
Name – Enter a name for the meter. his name will be used as a Tab name in the resulting spreadsheet.
Metric – Select the metric you will be measuring for this meter in the report as one of the following:
vCPU – virtual CPU. You can select to measure utilization, which is the average CPU utilization of this instance as reported by the instance. Or, you can select to measure allocation, which is the total CPU allocated for use by the application when the application was created.
Memory (GiB) - You can select to measure utilization, which is the amount of data currently held in memory by the application instance. Or, you can select to measure allocation, which is the total memory allocated for use by the application when the application was created.
Network Bandwidth (Mbps) – amount of data received and transmitted from the network
Storage Bandwidth (Mbps) – amount of data transferred inbound and outbound from the disk(s) to the node.
Storage IOPS – You can select to measure utilization which refers to the number of read/write requests per second to the disk(s).
Storage Capacity (GiB) – You can select to measure utilization, which is the Storage used by the current instance, including snapshots on both local and all replication sites, but not including the base image, for instances created from template. This refers to the Storage used by the current instance, including snapshots on both local and all replication sites, for instances created from installer. You can also select to measure allocation, which is the total storage allocated for use by the application when the application was created.
Measure – Select the measure for the metric as applicable. You can select either Utilization or Allocation for vCPU, Memory, and Storage Capacity metrics. You can only select Utilization for Network Bandwidth, Storage Bandwidth and Storage IOPS metrics. Generally, utilization refers to the amount of the resource that is currently in use by the application. Allocation refers to the total resources allocated for use by the application when the application was created.
Rate and Rate Interval – Enter a Rate and Rate Interval for this meter. The Rate is used with Rate Interval to define the Cost Metric to charge for the meter. For example, a rate of $0.01 and a rate interval of 1 hour translates to $0.10 per hour.
- Click Add Another Meter to add another meter to the report and repeat the preceding step. Otherwise, proceed to the next step.
- To modify the application or Data Center, select or remove Applications and/or Data Centers for which to run the report. You can select more than one.
- Click Save or click Save and Add Another if you want to create another report.