Monitor resources in the Dashboard
The Dashboard page in the Cloud Controller shows the resources that are available to VDCs or to the entire organization, depending on the user role of the account that is accessing the Cloud Controller.
When infrastructure admin or infrastructure viewer users log in to the Cloud Controller, the Dashboard displays the physical and virtual resources for the entire organization.
When VDC manager or VDC viewer users log in to the Cloud Controller, the Dashboard displays the virtual resources for the VDCs to which users have access.
Complete the following steps to monitor resources.
- Choose the time frame over which you want to view the resources.
You can choose to view information about resources for a specific time frame, such as the last hour or the last year:
Figure 1. Choosing a time frame for which to view resources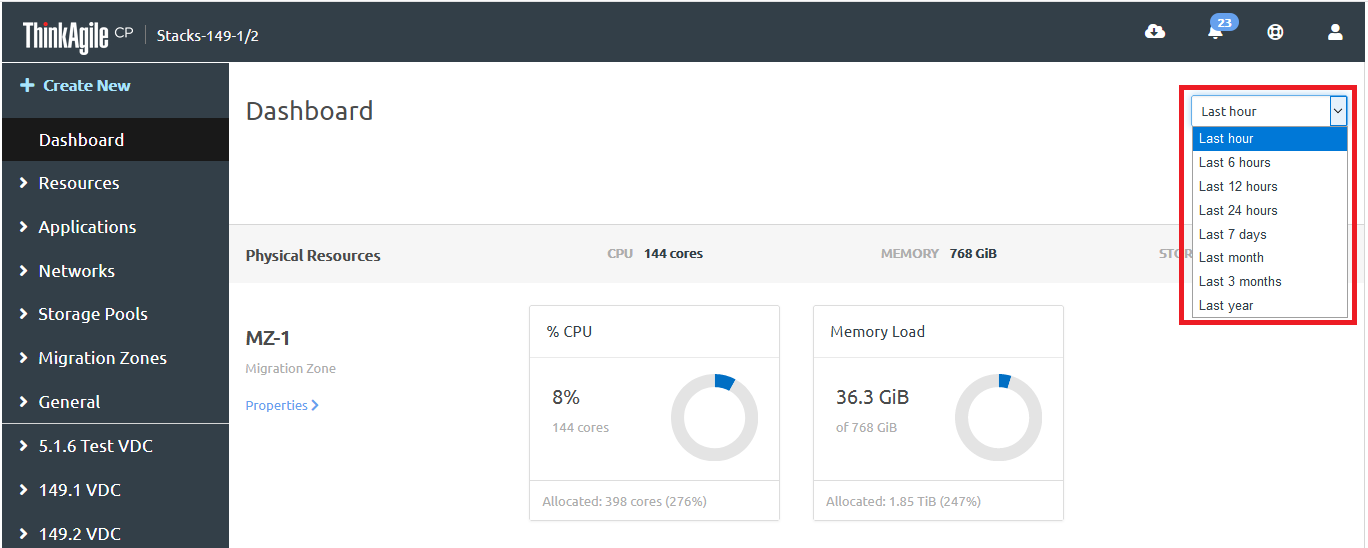
- View the physical resources for migration zones and storage pools (infrastructure admin and infrastructure viewer users).
To obtain more detailed information about the physical resources for migration zones or storage pools, click Properties to display the Details page.
Figure 2. Hardware resources - Properties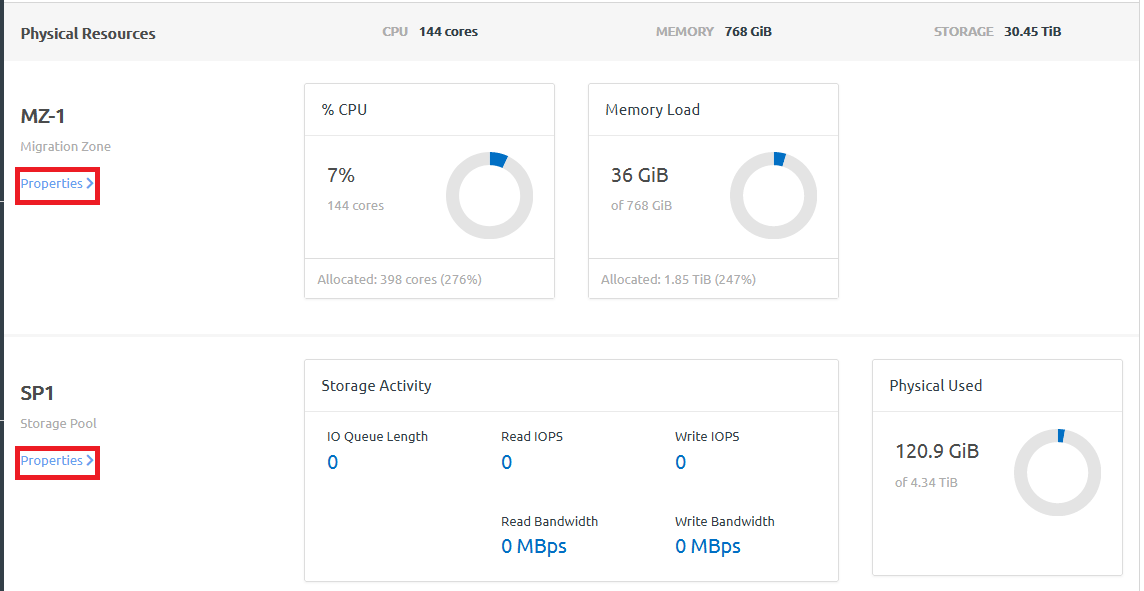 For more information about the Details page, see the following topics:
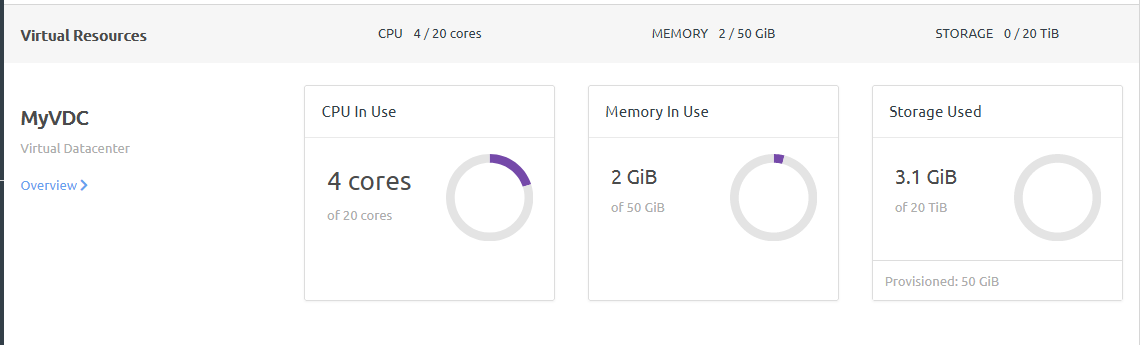
 - Scroll down to view the virtual resources allocated to the VDCs to which you have access.Figure 3. Virtual Resources
 Note
NoteFor infrastructure admin or infrastructure viewer users, virtual datacenters are shown for the organization, and values shown under Virtual Resources are calculated based on all virtual datacenters in the organization. For VDC manager or VDC viewer users, the virtual datacenters and values shown for the virtual resources are calculated based on the virtual datacenters to which the user has access.
CPU in-use is the number of virtual cores that are allocated to applications that are currently running.
Memory in-use is the amount of memory that is allocated to applications that are currently running.
Storage used is the amount of storage that is allocated to applications that are currentlly running.
ThinkAgile CP Cloud Controller uses Base 2 to calculate memory and storage capacity. When you are viewing statistics, it may appear that you have less memory or storage capacity than you expect. With Base 2, capacity is technically measured in kibibytes, mebibytes, gibibytes, and tebibytes, where the “-bi-” refers to binary. (In short these measurements are KiB, MiB, GiB, TiB. Most users do not think in terms of Base 2 and, therefore, hardware manufacturers typically rate drive capacities using standard base 10 numbers with KB, MB, GB, and TB measurements.)
To calculate capacity measured in KB using Base 2, total bytes are divided by 1024, which results in a slightly lower KB measurement than using Base 10. This reduction in bytes seems higher when measuring in TB. For example, if you have a 16TB disk, instead of seeing an expected 16,000 GB of capacity, you would see 14,896. However, there is technically no loss of capacity. The reported size appears smaller in gibibytes than when measured in gigabytes because the larger unit of measure results in a smaller total number.