View hardware
From the ThinkAgile CP Cloud Controller, infrastructure admin and infrastructure viewer users can view the hardware resources for an organization.
Complete the following steps to view the hardware for an organization.
- In the left navigation of the Cloud Controller, expand Resources and click Hardware to display the Hardware Stack page.Figure 1. View the Hardware Stack page
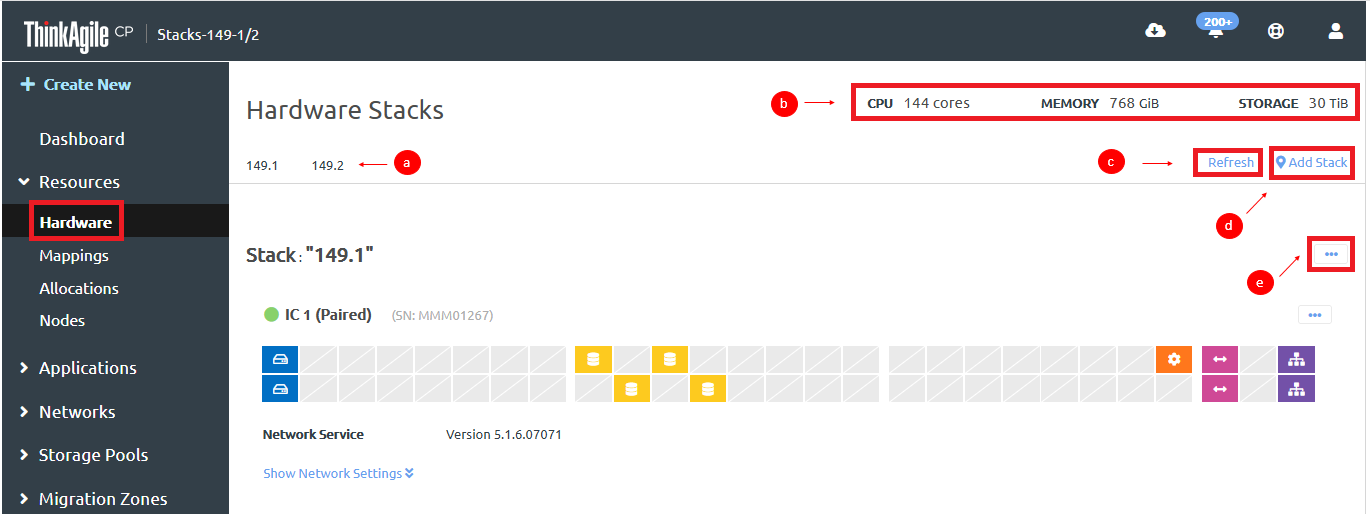
- Click the Actions menu (
 ) to manage the stack.
For more information about the Actions menu, see Manage a stack.
- Click the Actions menu (
- The interconnect switches handle the networking infrastructure.Figure 2. Interconnect switches section
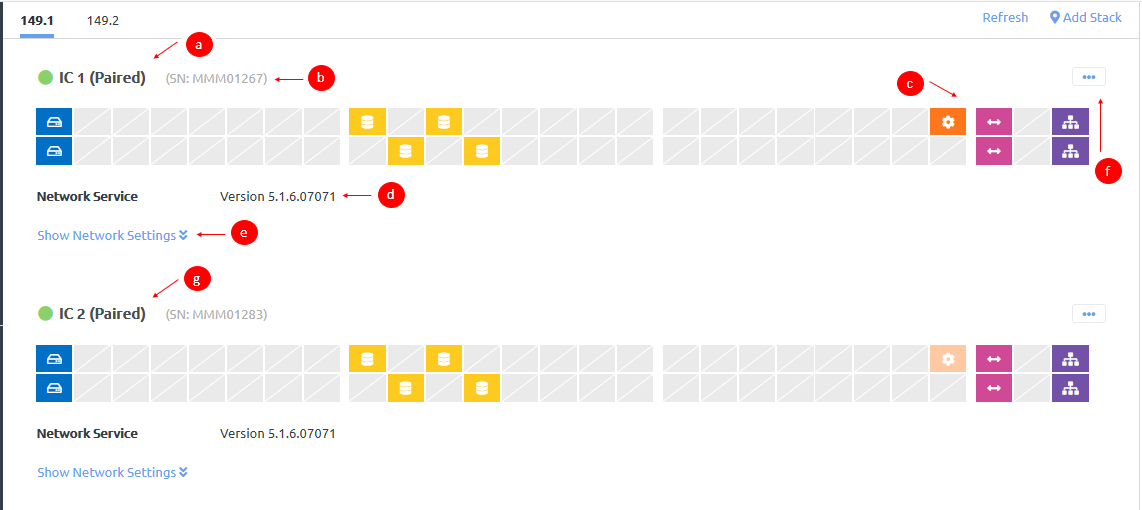
- View the ports for the interconnect switch. Mouse over the ports for more information, including port number, current status, and information about where the port is connected.
Icon Description 
Connected to node. 
Connected to storage controller. 
Connected to management network. 
Connected to data uplink/gateway. 
Connected to ISL network (for control traffic between the ThinkAgile CP interconnect switches). - Click Show Network Settings to view network details for the interconnect switch.Figure 3. Expanded network settings example
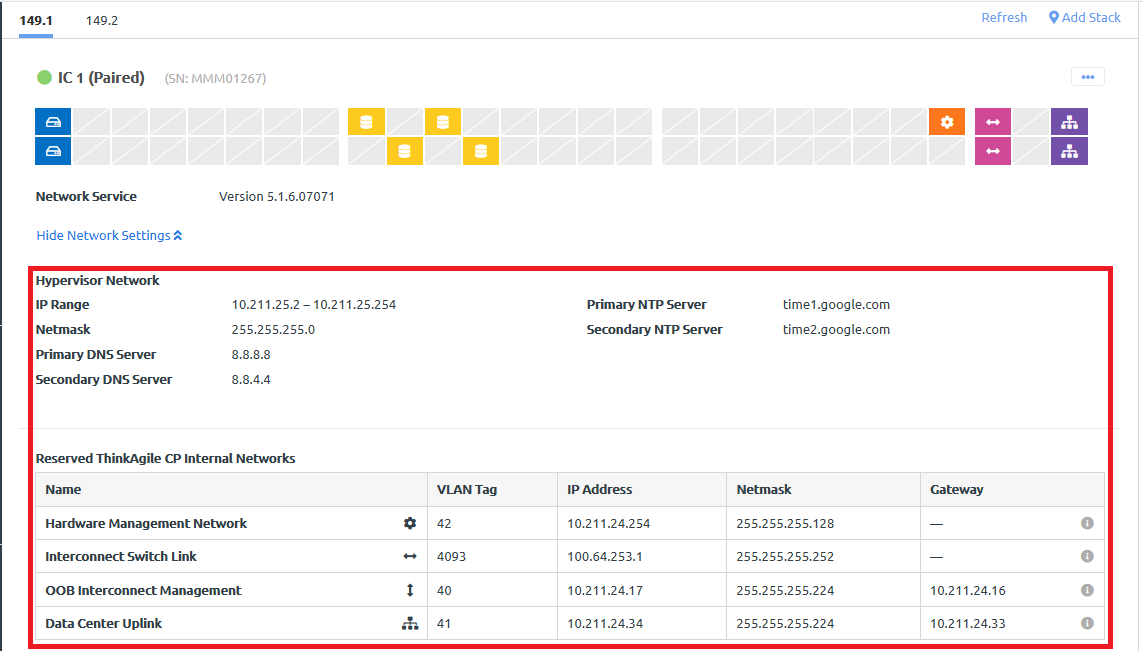 Details are provided for the hypervisor network. In addition, details about the reserved internal networks are displayed.
- Hardware Management Network. The network traffic for hardware monitoring and the out-of-band (OOB) management of the compute and storage chassis.
- Interconnect Switch Link (ISL). In a dual-interconnect configuration, the network for control traffic between the primary and secondary interconnect switches.
- OOB Interconnect Management. The network for control traffic between the interconnect switches and the ThinkAgile CP Cloud Controller.
- Data Center Uplink. The network for traffic between the interconnect switches and the customer network.
- Click the Actions menu () to manage the interconnect switch.
For more information about the interconnect switch Actions menu, see Manage interconnect switches.
- View the ports for the interconnect switch. Mouse over the ports for more information, including port number, current status, and information about where the port is connected.
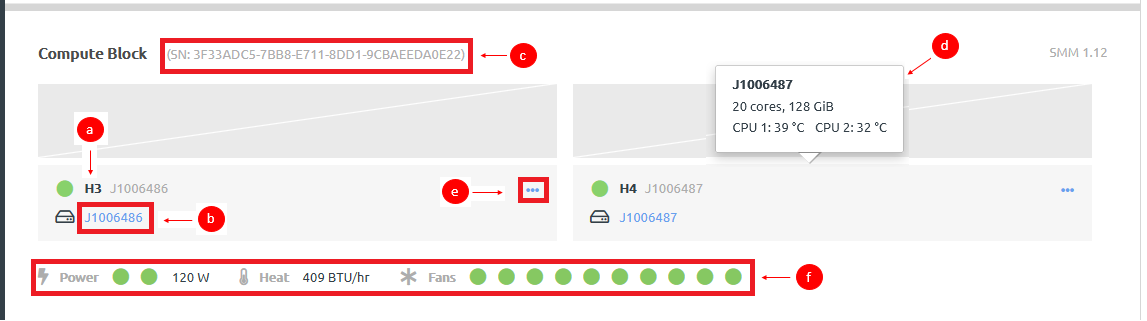
- Compute hardware consists of a set of discrete compute resources (nodes) housed in a compute enclosure (block). Each node provides CPU and memory resources for use by applications. Figure 4. Compute block section
 Note
NoteIf a compute node has not been registered, you will see a Register link before the node name. Unregistered compute nodes cannot be used to run applications. For more information about registering compute nodes, see the following topic:
- View identifying information about the compute node, including the name and the current power state. You can mouse over the power state to get more information.
Nodes can have the following power states:
State Description Powered on

The compute node is reachable and able to run application instances.
Powered off

The compute node has been powered off by the user (for example, for maintenance).
Unreachable

The compute node does not respond to the ThinkAgile CP management console and was not powered off by the user. If a compute node in your cloud infrastructure is unreachable, check your network connectivity or contact Lenovo Support.
Updating

The firmware running on the node is updating.
Maintenance Mode

The compute node has been registered and assigned to a compute category. Maintenance mode is a feature that allows you to keep a compute node online, registered, and assigned to a migration zone while simultaneously preventing any application instances from running on the compute node. This is useful when performing certain maintenance activities (for example, changing a compute node migration zone or compute category). When viewing the compute node profile page, a yellow Maintenance Mode indicator appears inline with the compute node category and tag(s).
- Click the Actions menu () to perform actions on the compute node, such as restarting a compute node or turning on maintenance mode.
For more information about actions that can be taken for a compute node, see the following topic:
- View identifying information about the compute node, including the name and the current power state. You can mouse over the power state to get more information.
- The storage block hardware consists of a set of two storage controllers and one or two storage sleds housed in a storage enclosure. Note
If a storage block has not been registered, you will see a Register link below the storage block name. For more information about registering storage controllers, see the following topic:
Figure 5. Storage block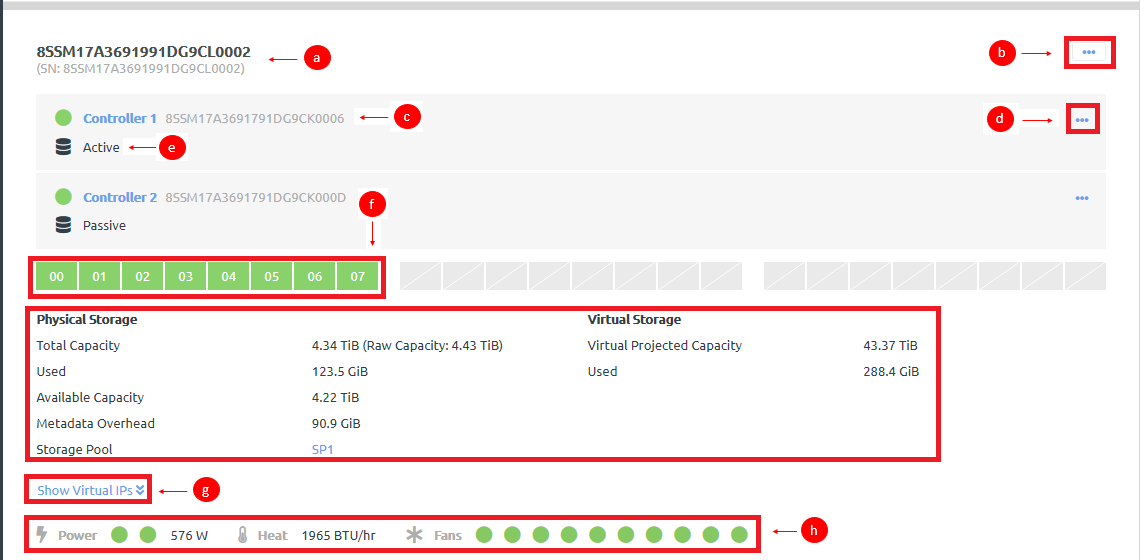
- Click the storage block Actions menu () to perform actions on the control block, such as restarting the storage block or removing the storage block from a storage pool.
For more information about actions that can be taken for a storage block, see the following topic:
- View identifying information for the storage controller, including the name and the current power state. You can mouse over the power state to get more information.
Storage controllers can have the following power states:
State Description Powered on
The compute node is reachable and able to run application instances.
Powered off
The compute node has been powered off by the user (for example, for maintenance).
Unreachable
The compute node does not respond to the ThinkAgile CP management console and was not powered off by the user. If a compute node in your cloud infrastructure is unreachable, check your network connectivity or contact Lenovo Support.
- Click the storage controller Actions menu () to restart the storage service.
For more information about the storage controller Actions menu, see the following topic:
- Click the storage block Actions menu (