View migration zone metrics
Infrastructure admin and infrastructure viewer users can view metrics about a migration zone, such as CPU usage and, memory usage.
Complete the following steps to view compute node metrics.
- In the left navigation, expand Migration Zones and click the migration zone to display the migration zone details page.Figure 1. Migration zone details page
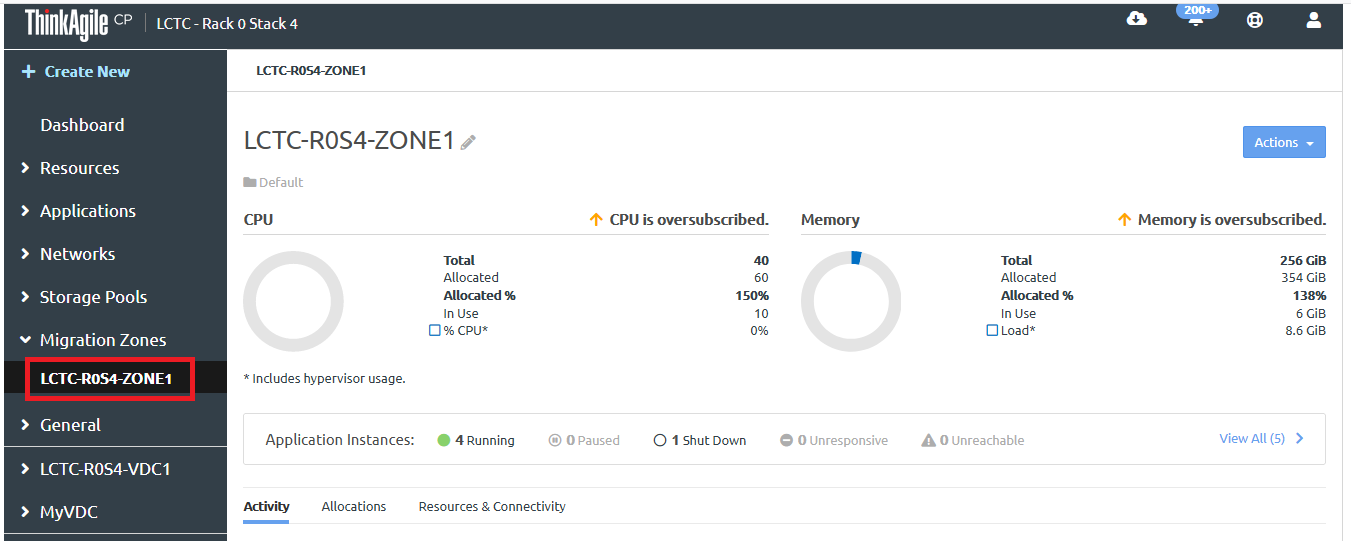
- The Activity tab shows the metrics that are available.Figure 2. Activity tab on migration zone details page
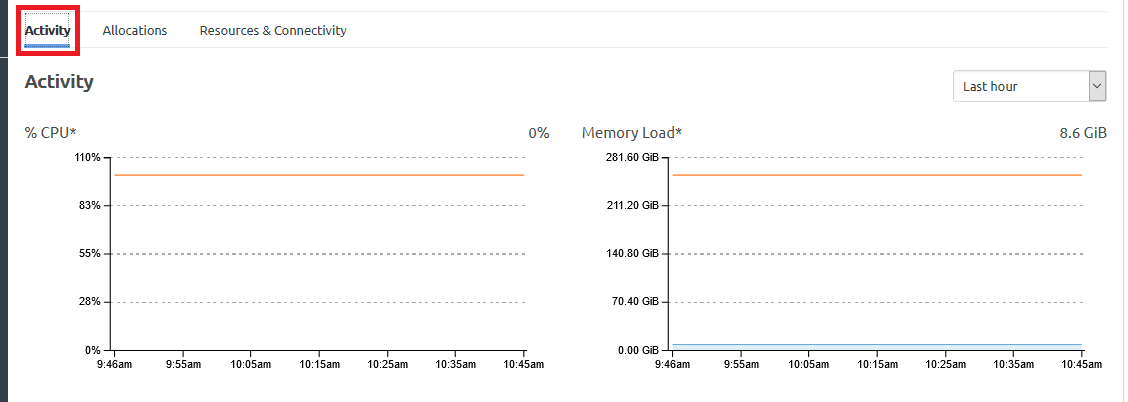 On the Activity tab, the following charts are displayed:
%CPU. The average CPU utilization of the compute node, including hypervisor usage.
Memory Load. The amount of data currently held in memory by running and paused instances on the compute node, as well as hypervisor usage.
You can choose to display this activity over different time frames ranging from the last hour to the last year.
Figure 3. Compute node metrics timeframes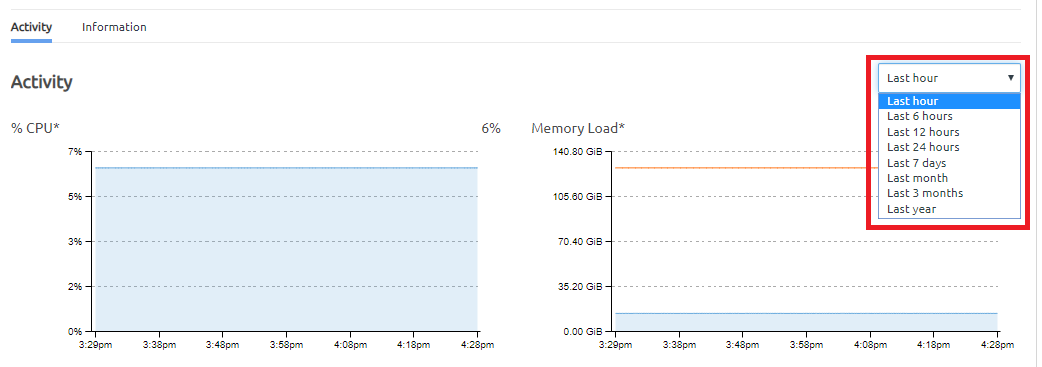
Give feedback