Viewing virtual datacenter details
A virtual datacenter (VDC) is a logical grouping of compute and storage resources allocated from one or more migration zones and one or more storage pools, usually to a business unit in an organization. In the ThinkAgile CP environment, the virtual datacenter is the ultimate organizing construct to manage allocations and help you manage your application instances (virtual machines).
Complete the following steps to view the details for a virtual datacenter:
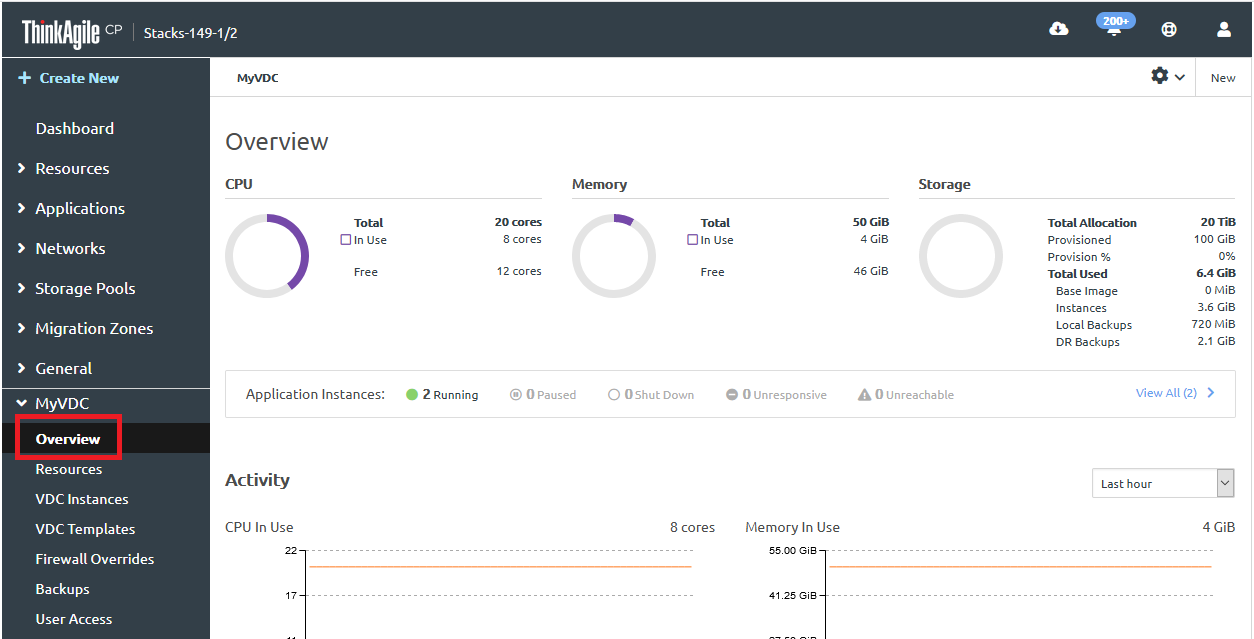
- In the left navigation menu, click to select and expand the virtual datacenter you want to view, and then click Overview to view the Overview page.Figure 1. The VDC Overview page
- At the top of the Overview page, you can view resource utilization for the VDC.Figure 2. VDC resource utilization
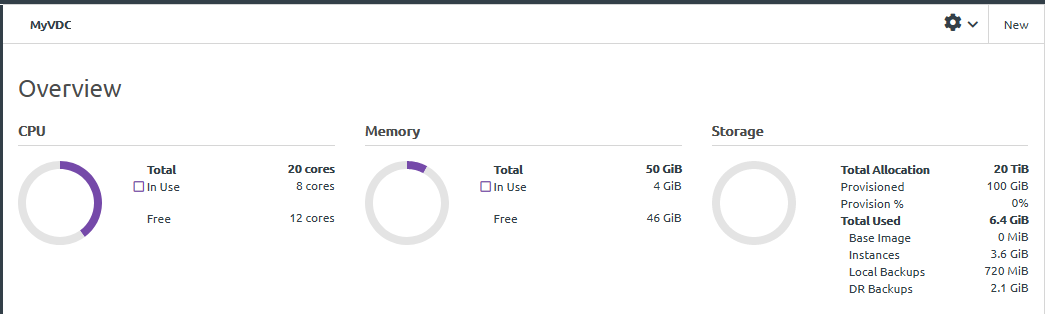
CPU. The processors allocated to the virtual datacenter from migration zones. This is broken down into CPU in use by application instances and free CPU.
Memory. The memory allocated to the virtual datacenter from migration zones. This is broken down into memory in use by application instances and free memory.
Storage. The storage allocated to the virtual datacenter from storage pools. The amount of storage allocated and provisioned to application instances from the virtual datacenter is shown. If the provisioned storage is greater than the allocated storage, the storage pool is over-provisioned. In addition, the storage is broken down into how it is used ( for base images, for application instances, or local backups, and for quick DR backups).
- Next to Application Instances, you can view the number of application instances in this virtual datacenter that are Running, Paused, Shutdown, Unresponsive, or Unreachable. NoteInfrastructure admin users and
Infrastructure viewer users can click View All to view all application instances in this virtual datacenter. Figure 3. VDC application instances
- In the Activity section, you can view the following charts that show recent activity in the virtual datacenter. You can adjust the time interval displayed in the Activity charts from the last hour up to the last year.Figure 4. VDC activity details
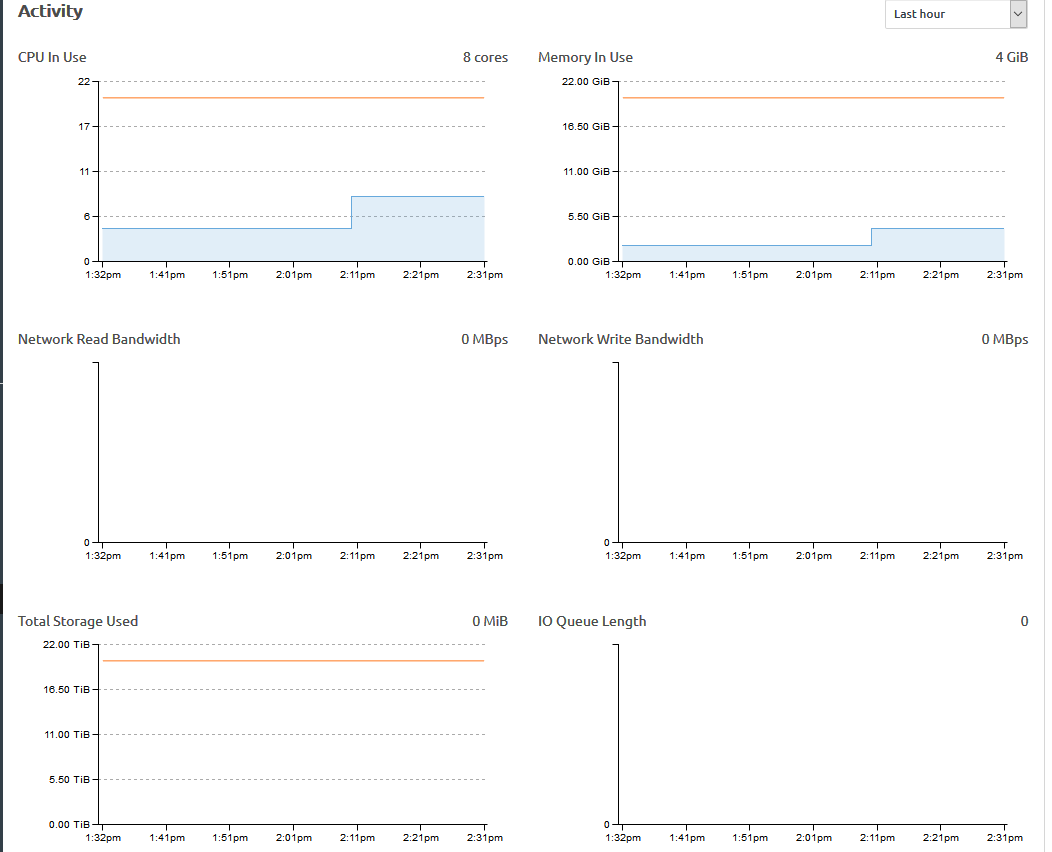
- CPU in Use. The number of CPU cores allocated to this VDC and the number of CPU cores in use by all running and paused instances in this virtual datacenter. You can mouse over this interactive chart to view more granular detail down to the minute.
- Memory in Use. The total provisioned memory allocated to this VDC, in gigabytes, and the amount of memory currently in use. Unit of measure is GB. You can mouse over this interactive chart to view more granular detail down to the minute.
- Network Read Bandwidth. Amount of data received from the network.
- Network Write Bandwidth. Amount of data transmitted to the network.
- Total Storage Used. The storage used by all instances in this virtual datacenter, in bytes, including backups (local backups and quick DR backups). This does not include the base image. You can mouse over this interactive chart to view more granular detail down to the minute.
- IO Queue Length. Number of outstanding I/O requests to the disk(s).
- Storage Read Bandwidth. Data transferred outbound from the disk(s) to the node.
- Storage Write Bandwidth. Data transferred inbound from the node to the disk(s).
NoteFor more information about the storage activity charts, see the following topic: