Collections
A collection is a group of devices that can be monitored together. A device can belong to one or more collections.
You can add collections to the organization and monitor the overall health of all devices in each collection. You can click the collection card title to list all devices in the collection and add or remove devices from the collection.
- Static collection: A fixed group that contains a list of explicitly added devices.
- Dynamic collection: A group that includes devices matching user-defined rules combined with AND and OR conditions. The members of a dynamic collection are automatically updated whenever devices begin or stop meeting those rules.
To create a collection, click the Device Management view, and then click the Add icon (![]() ) from the Collections panel. Follow the steps in the wizard to complete the process.
) from the Collections panel. Follow the steps in the wizard to complete the process.
Current usage metrics
You can monitor usage metrics for all devices in a specific collection from the Usage panel by clicking the Collections panel title from the Device management view.
The Metrics panel shows the maximum (pale color), minimum usage (vivid color), and average usage (black diamond) for each component during the last hour.
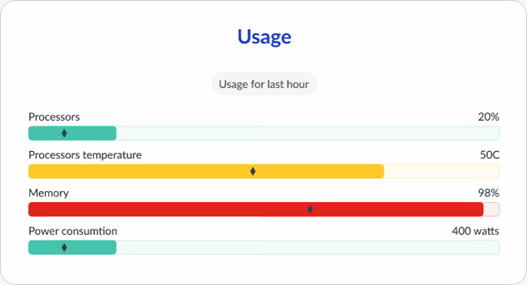
- Green. The actual usage is less than the warning threshold. The default threshold is 80% of the available amount.
- Amber. The actual usage is between the warning and critical threshold.
- Red. The actual usage is greater than the critical threshold. The default threshold is 90% of the available amount.
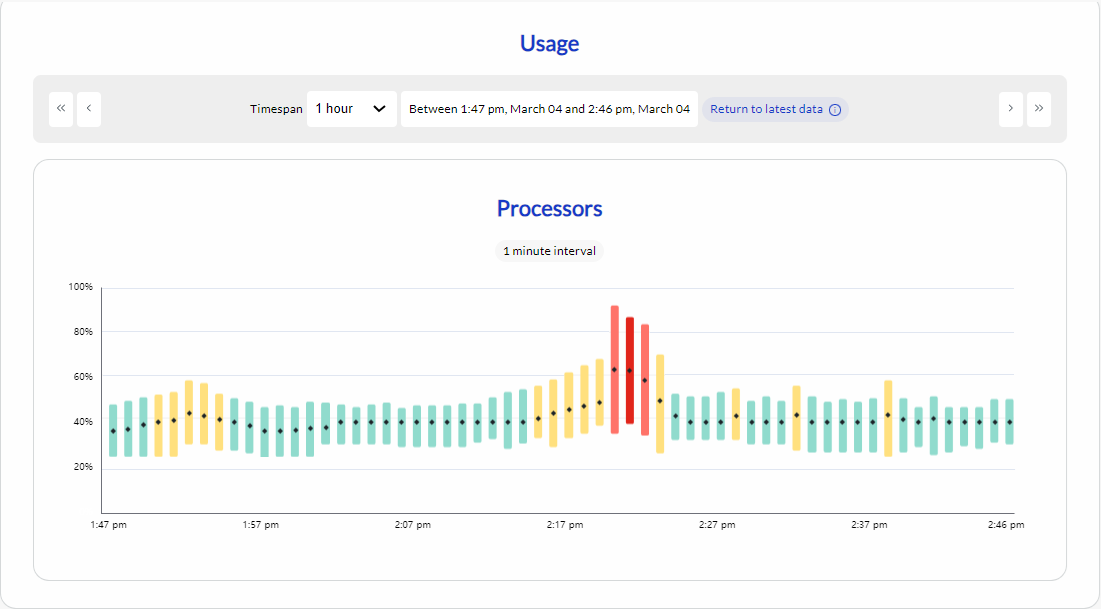
Usage trends over time
You can see the maximum usage trends over time by clicking the Metrics panel title to display the Metrics page. This page shows minimum, maximum, and average (black diamond) usage for each component over time. The color (green, amber, or red) indicates whether the maximum usage exceeds the thresholds.
XClarity One stores granular metric data for 6 hours. Each hour is aggregated and retained for up to 365 days. Each day is aggregated and retained for up to 12 months.
Usage during the last minute is displayed by default. You can change the time span to show usage during the last hour (in 1-minute intervals), 24 hours (in 1-hour intervals), or 30 days (in 1-day intervals). You can also scroll forwards and backwards in time, based on the selected period, using the scroll icons.
Call Home contacts
When Call Home is configured and a serviceable event is triggered that automatically creates a service ticket, Lenovo Support might need to reach out to someone regarding the event. The primary or secondary contact that is configured for Call Home is contacted by default. However, you can choose to assign a different Call Home contact to all devices in a specific collection.
You can provide a Call Home contact and shipping address when you create the collection by enabling Provide a Call Home contact for devices in this collection.
If a contact is assigned to a collection, and you add more devices to that collection, the preferred contact is also assigned to the new devices.
If you assign a contact to a collection, and some devices in that collection are also in another collection to which a contact was assigned, you can choose whether to change the assignment to the new contact or to keep the existing contact.
If you delete a collection that has an assigned contact, the preferred contact for each device in the collection resets to the default Call Home contact.