Device usage metrics and trends
You can monitor usage metrics for a specific device by clicking the Managed devices panel title from the Device management view, and then click the name of the device in the table to display the device details page. Usage metrics are graphically displayed on the Metrics panel.
You can customize the panel to show data for metrics that interest you the most and the time period by clicking the Settings icon (![]() ) next to the panel title. The metrics that are available depend on the managed-device type.
) next to the panel title. The metrics that are available depend on the managed-device type.
Lenovo servers
- Memory. (default) Percentage of total memory channel controller bandwidth currently in use (which does not reflect the amount of memory currently being used)
- Memory Power. Power consumption, in Watts, by all memory modules
- Processors. (default) Percentage of the total processor bandwidth that is currently in use, as measured by the performance counters built in the processor (which might differ slightly from the processor usage reported by the operating system)
- Processor Power. Power consumption, in Watts, by all processors
- Processor Temperature. (default) Core internal (junction) temperature, in Celsius, for all processors
- System Power. (default) Power consumption, in Watts, by the device
Current usage metrics
The Metrics panel shows the maximum (pale color), minimum usage (vivid color), and average usage (black diamond) for each component during the last hour.
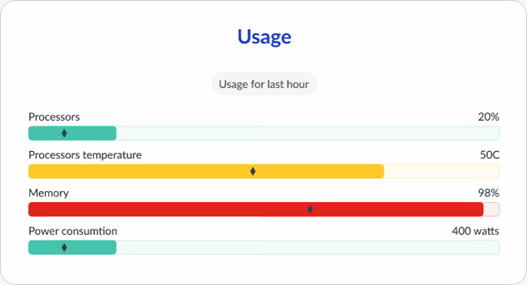
- Green. The actual usage is less than the warning threshold. The default threshold is 80% of the available amount.
- Amber. The actual usage is between the warning and critical threshold.
- Red. The actual usage is greater than the critical threshold. The default threshold is 90% of the available amount.
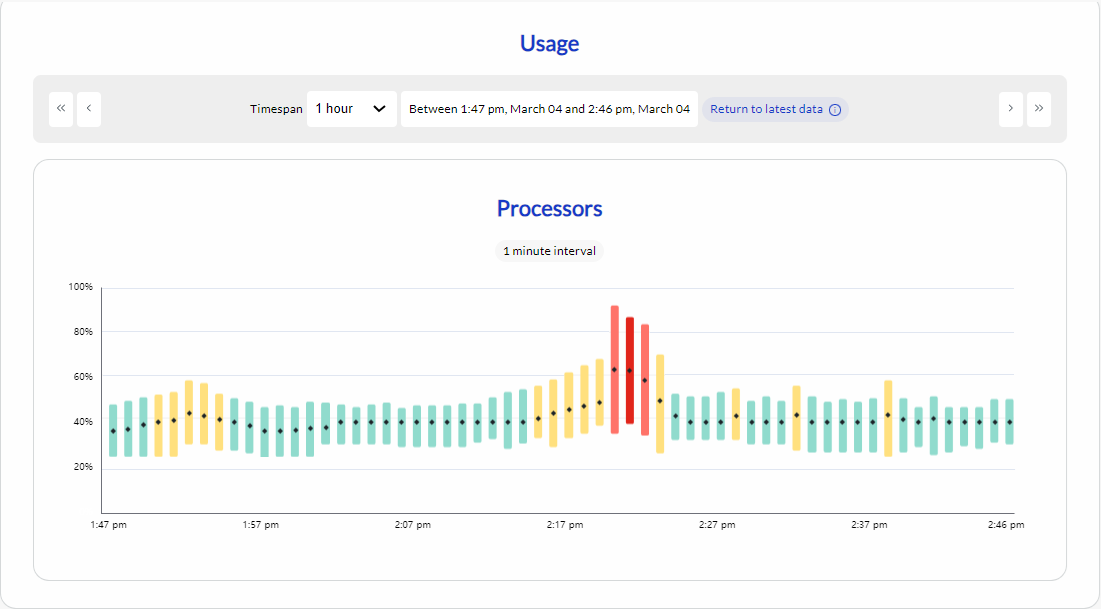
Usage trends over time
You can see the maximum usage trends over time by clicking the Metrics panel title to display the Metrics page. This page shows minimum, maximum, and average (black diamond) usage for each component over time. The color (green, amber, or red) indicates whether the maximum usage exceeds the thresholds.
XClarity One stores granular metric data for 6 hours. Each hour is aggregated and retained for up to 365 days. Each day is aggregated and retained for up to 12 months.
Usage during the last minute is displayed by default. You can change the time span to show usage during the last hour (in 1-minute intervals), 24 hours (in 1-hour intervals), or 30 days (in 1-day intervals). You can also scroll forwards and backwards in time, based on the selected period, using the scroll icons.
Usage-metric thresholds
Thresholds for these usage metrics are enabled by default. When enabled, an alert is raised when a component meets or exceeds its warning or critical threshold for the alert duration. The alert duration is the number of minutes during a specific period that the threshold value must be met or exceeded. For example, if processor usage has a warning threshold of 80% and alert duration of 4 of 10 minutes, then an alert is raised when the processor usage exceeds 80% for 4 or more minutes within a 10-minute period.
The minimum interval is 2 minutes within a 5-minute period.
You can set warning and critical usage thresholds and the alert duration for the certain components by clicking the Alert rules tab on context menu from the Settings view and then clicking the row for the component that you want to change.