Device details
You can view detailed information about a specific device by clicking the Managed devices panel title from the Device management view, and then click the name of the device in the table to display the device details page. The device details page includes device-specific todos, component status, usage metrics, system information, and actions that you can take on the device. From this page, you can drill down to see jobs, events and alerts, firmware, and hardware inventory.
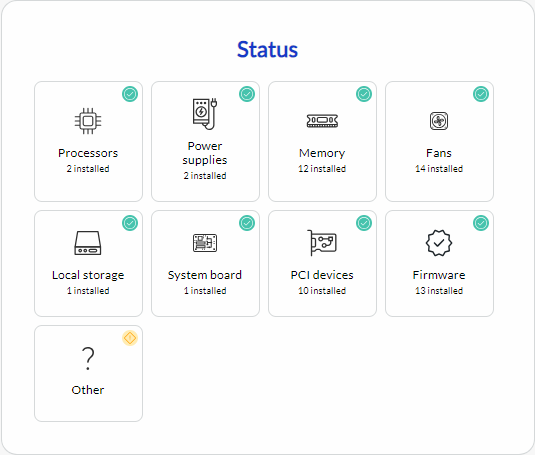
Component status
The Status panel shows the heath of each component in the device.
- Hardware components. Based on the highest severity of all events that are associated with each component, such as processors, memory, fans, and PCI devices.
- Firmware. Based on age and number of vulnerabilities.
- Vulnerabilities. Based on whether the component firmware has warning or critical vulnerabilities.
- Other. Based on the highest severity of all events of other categories, such as warranty.
Usage metrics and trends
You can monitor usage metrics for a specific device from the device details page. Usage metric data is graphically displayed on the Usage panel. For more information, see Device usage metrics and trends.
Alerts and events
You can monitor all alerts and events for a specific device by clicking Monitors in the context menu on the device-details page. For more information about events and alerts, see Alerts and events.
Vulnerabilities
You can monitor all vulnerabilities for a specific device by clicking Monitors in the context menu on the device-details page. For more information about events and alerts, see Vulnerabilities.
Jobs
You can monitor all jobs for a specific device by clicking Monitors in the context menu on the device-details page. For more information about jobs, see Jobs.
Service tickets
You can monitor all service tickets for a specific device by clicking Monitors in the context menu on the device-details page. For more information about service tickets, see Service tickets.
Hardware inventory
You can view a list of hardware components (such as processors, memory, drives, power supplies, fans, add-in and onboard cards, and system board) that is in a specific device by clicking Hardware inventory in the context menu on the device-details page.
When XClarity One detects error patterns that might lead to critical issues, potential downtime, or imminent failure of memory modules and solid-state drives, warnings are displayed on Memory card with recommended actions to resolve the issue. For more information, see Predictive failure analysis.