Metrics and activity
You can view information about application instance resource utilization on the application instance details page.
CPU, memory, and storage charts
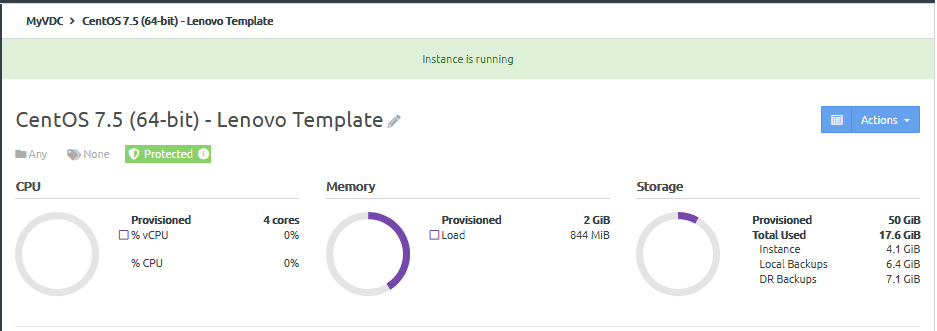
The following three charts are displayed at the top of the application instance page.

- Provisioned CPU. The percentage of CPU provisioned to the application instance when it was created. %vCPU is the average virtual CPU utilization on the cores provisioned to this application as reported by the instance. %CPU is the average real CPU utilization on the cores provisioned to this application as reported by the node.
- % vCPU. The average virtual CPU utilization on the cores provisioned to this application as reported by the instance. %CPU is the average real CPU utilization on the cores provisioned to this application as reported by the node.
- Memory. The memory provisioned to the application instance when it was created. The Load represents the current memory utilization of the instance.
Storage. The storage provisioned to the application instance when it was created, as well as the amount of storage used.
NoteFor Windows-based application instances, you will notice a minor discrepancy on storage space reported on the portal versus the disk properties inside the operating system. This is due to the Windows file system formatting overhead, associated with NTFS.
Instance. For instances created from a template, this is the storage used by the current instance but does not include base image size or backups. For instances created from an installer, this is the storage used by the current instance but does not include backups.
- Local Backups. For instances created from a template, this is the storage used by all local backups but does not include base image. For instances created from an installer, this is the storage used by all local backups.
- DR Backups. For instances created from a template, this is the storage used by replicated backups at all replication sites. For instances created from an installer, this is the storage used by replicated backups at all replication sites.
If you see a Thin-Provisioned label for this instance, this instance is a thin-provisioned application clone. The "Storage Used" by the instance represents only the size of this application clone the base image size is counted once in the virtual datacenter's storage usage, as the base image may be shared by multiple application clones within the virtual datacenter.
Application instance activity charts
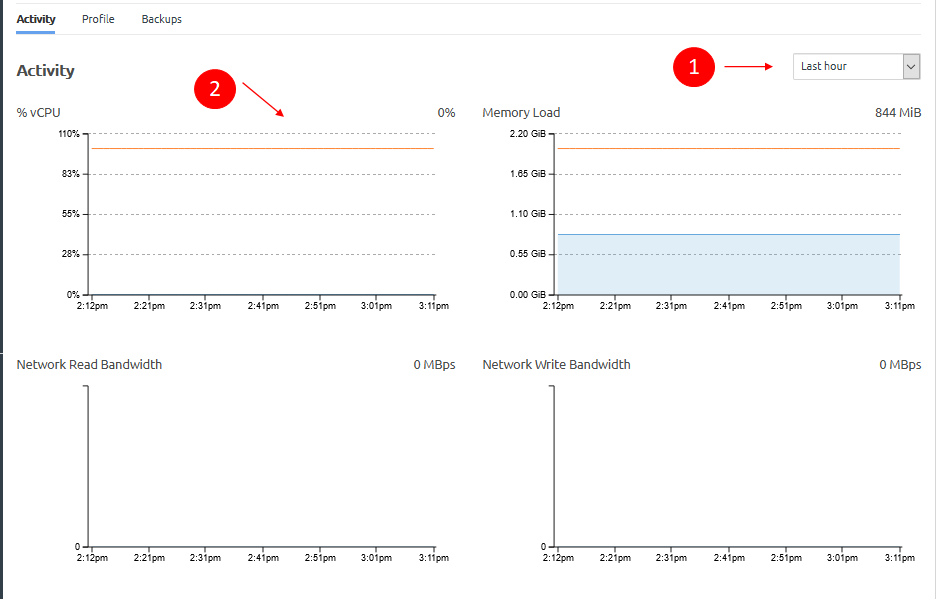
The Activity tab displays several charts that show recent activity for the instance.

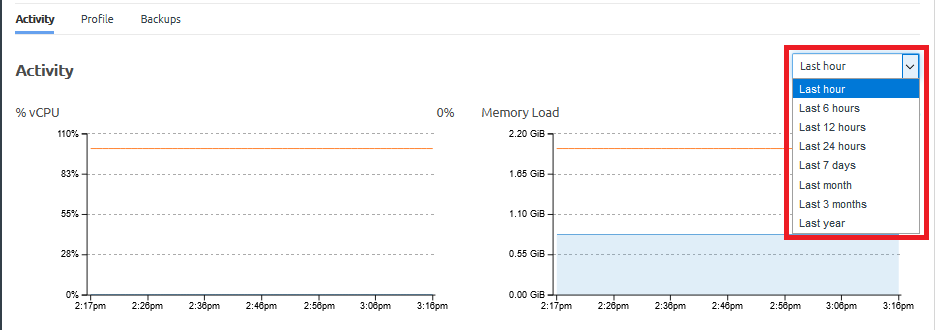
You can adjust the time interval displayed in the charts by selecting one an interval from the last hour to the last year.
Figure 3. Application instance activity interval
The following activity information is displayed.
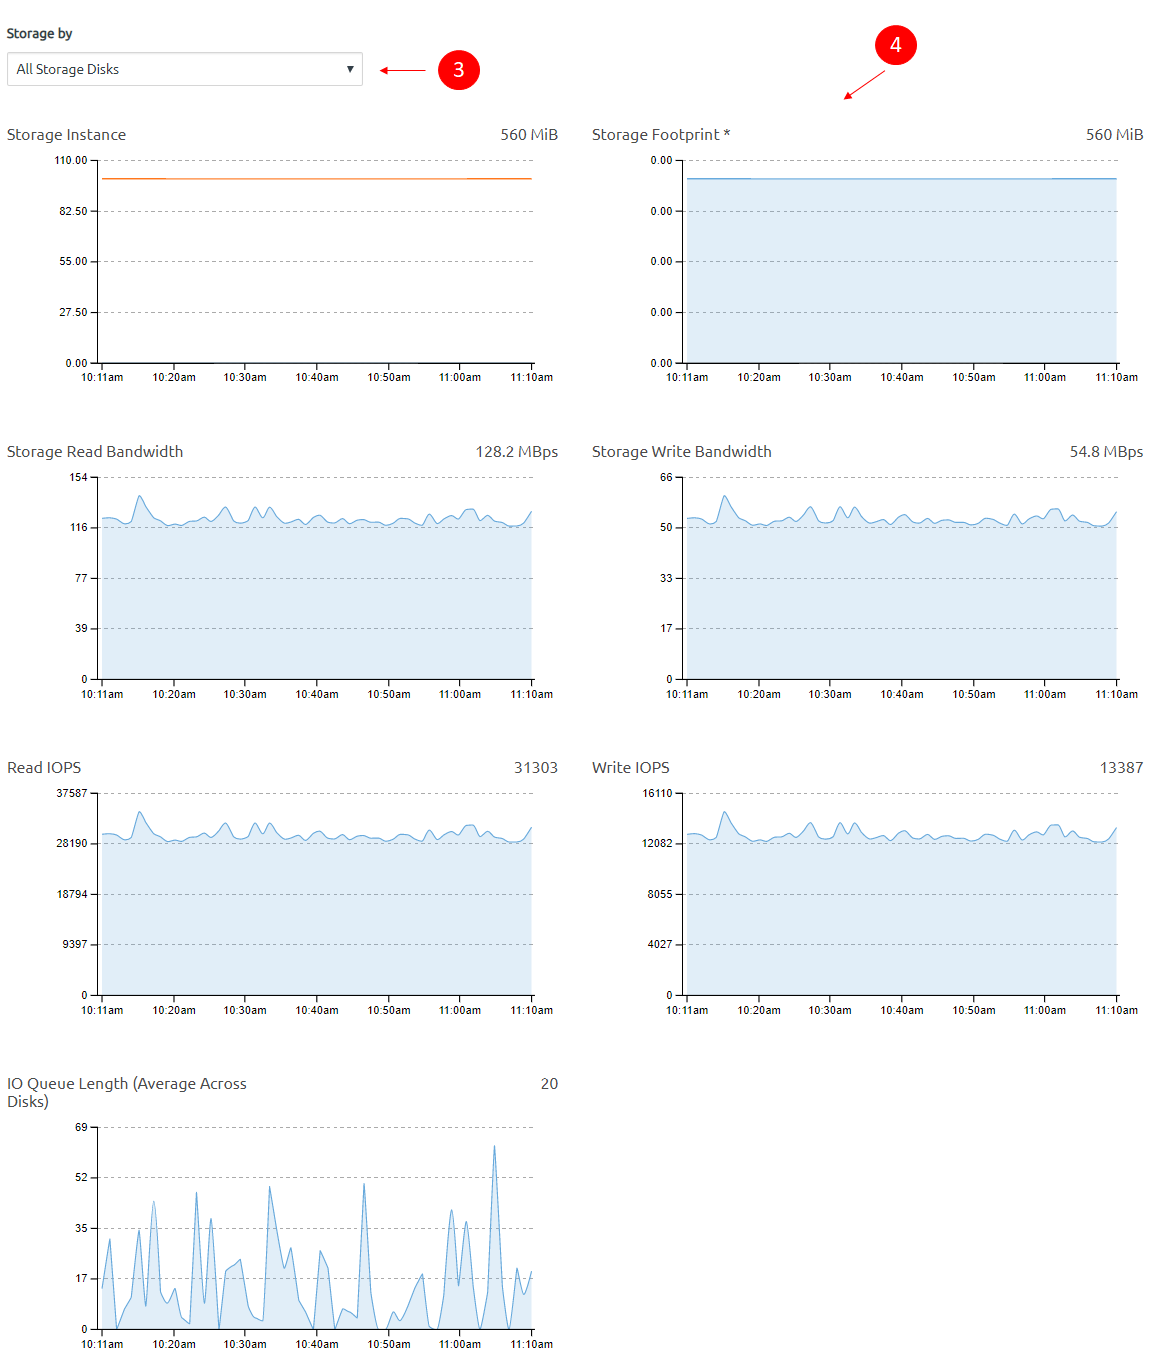
Activity Chart Description % vCPU Average virtual CPU utilization on the cores provisioned to this instance as reported by the instance. Memory Load The amount of data (in bytes) currently held in memory by this instance. This is the memory usage from the application perspective. Network Read Bandwidth The amount of data received (in MBps) from the network. Network Write Bandwidth The amount of data (MBps) transmitted to the network. You can also view storage activity by all storage disks or by selecting a specific disk. If you select a disk, an additional chart will be displayed that shows Disk Latency for the selected disk.
Figure 4. Application instance storage charts on an application instance page
You can view the following storage pool information.
Storage Activity Chart Description Storage Instance
For instances created from a template, this is the storage used by current instance. It does not include the base image size or backups.
For instances created from an installer, this is the storage used by current instance. It does not include backups.
Storage Footprint
For instances created a template, this is the storage used by current instance, including local backups and quick DR backups. It does not include the base image.
For instances created from an installer, this is the storage used by current instance, including local backups and quick DR backups. (It does not include the base image size of thin-provisioned clones.)
Storage Read Bandwidth
The amount of data transferred (in MBps) outbound from the disk(s) to the node. Storage Write Bandwidth
The amount of data transferred (in MBps) inbound from the node to the disk(s). Read IOPS The number of read requests per second to the disk(s). Write IOPS The number of write requests per second to the disk(s). IO Queue Length (Average Across Disks) Outstanding I/O requests to the disk(s). Disk Latency If you select a disk, an additional chart will be displayed that shows Disk Latency for the selected disk. Latency is a measure of how long it takes for a single I/O request to occur from the standpoint of the application instance.