View storage pool activity
Infrastructure admin and infrastructure viewer users can view details about the storage pools that are associated with an organization.
Complete the following steps to view storage pool activity.
- In the ThinkAgile CP Cloud Controller management portal, perform one of the following steps:
On the Dashboard page, scroll down to the list of storage pools in your ThinkAgile CP infrastructure. Then for the storage pool for which you want to view details, click Properties.
Figure 1. Storage pool properties on Dashboard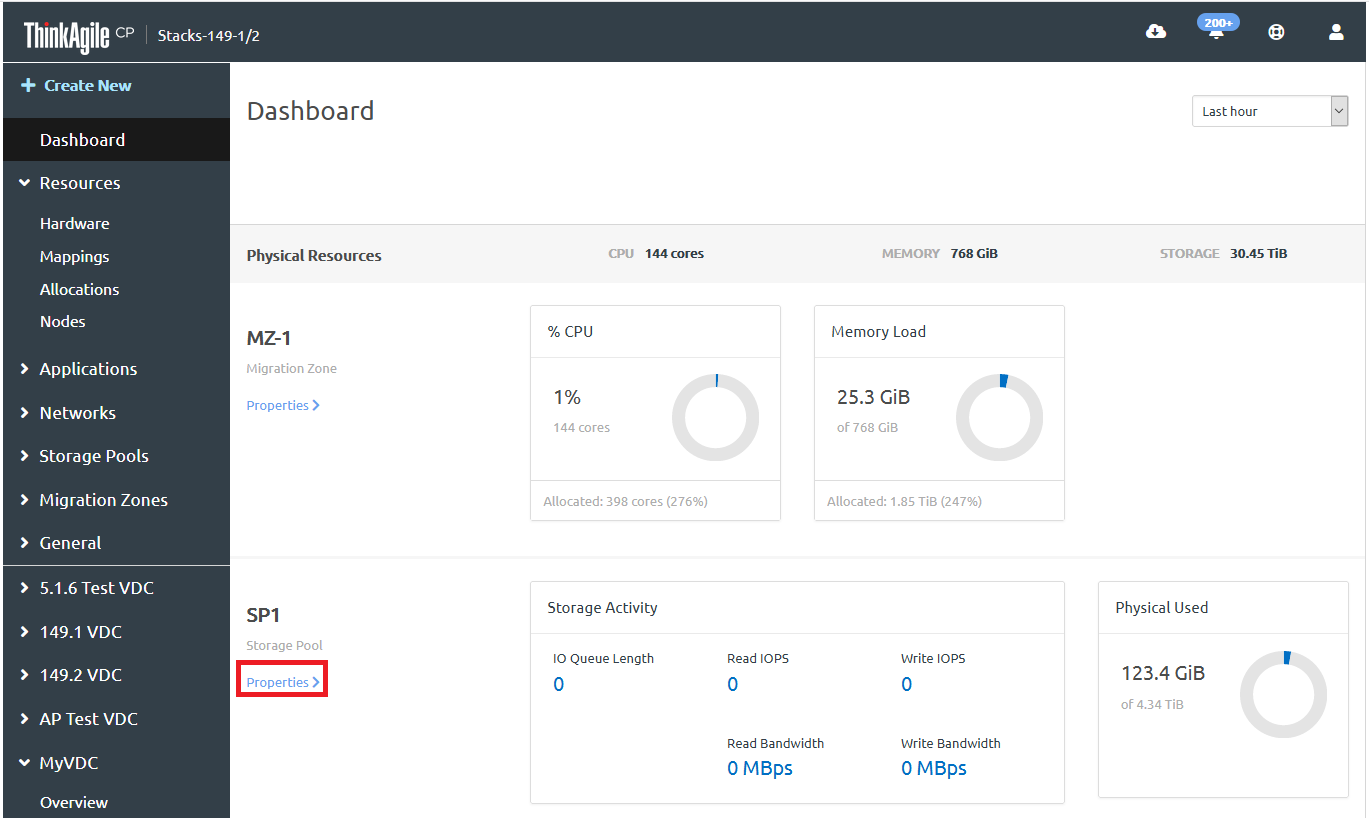
In the left navigation menu under Storage Pools, click the storage pool for which you want to view details.
Figure 2. Select storage pool from navigation menu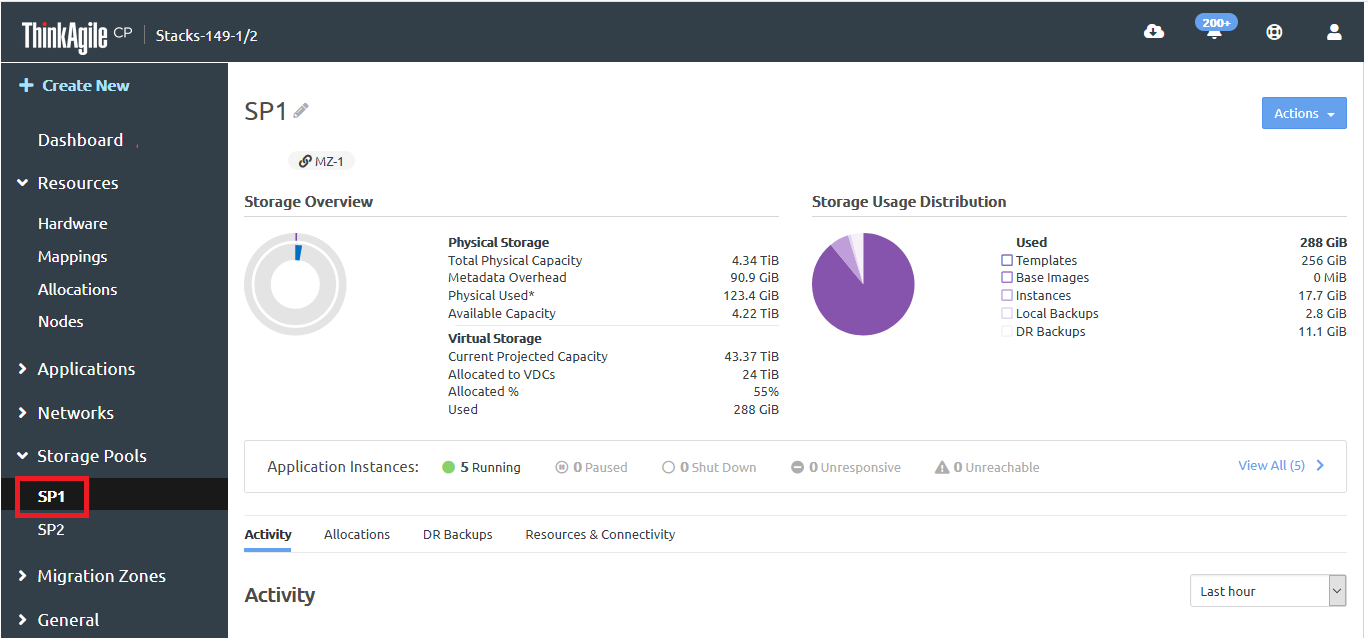
- Scroll down to view the activity charts.NoteBy default, activity for the last hour is displayed. However, you can adjust the time interval from the last hour to the last year.Figure 3. Activity section of the storage pool details page
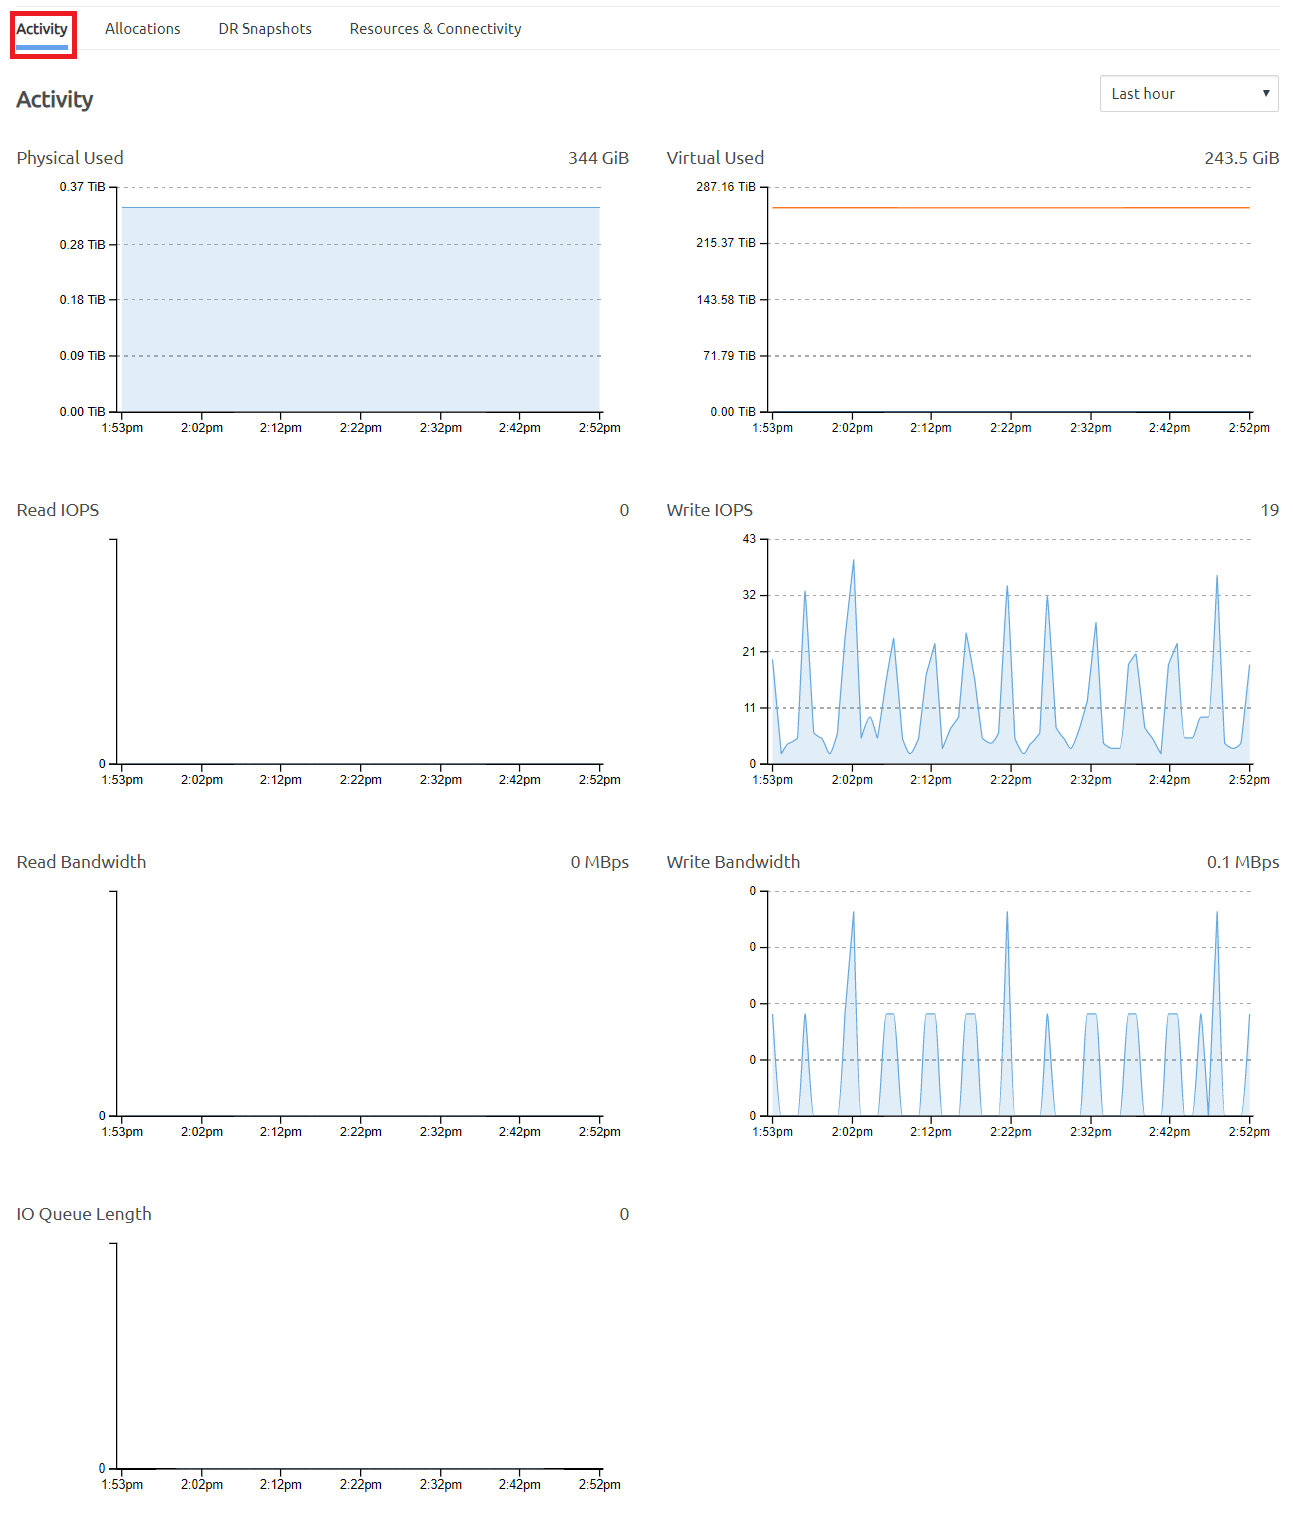
The following charts are displayed on the Activity tab.
- Physical Used. The total physical storage used in this storage pool after compression and deduplication.
- Virtual Used. The virtual storage used by application instances, backups (local and quick DR backups), base images, and the templates before compression and deduplication.
- Read IOPS. Number of read requests per second to the disk(s).
- Write IOPS. Number of write requests per second to the disk(s).
- Read Bandwidth. Number of read requests per second to the disk(s).
- Write Bandwidth. Data transferred inbound from the node to the disk(s).
- I/O Queue Length. Number of outstanding I/O requests to the disk(s).
Give feedback