Viewing host hardware topology
This topic describes how to view hardware topology information about a server, including front, middle, and rear panel views, vSAN disk details, power supply, and health status information. You can also perform operations on the topology.
Before you begin
- Only ThinkAgile VX models support the hardware topology function. For more information, see Supported machine types and functions.
- Ensure that the current server has been managed by
XClarity Administrator, andXClarity Administratorhas been registered with this system.
Procedure
Click Resources (![]() ) > Hosts to enter the host management page. Click a host name to enter the host details page.
) > Hosts to enter the host management page. Click a host name to enter the host details page.
Viewing topology information
Front panel
Provide a virtual view of disks installed in the server's front panel slots, and display the status of the power LED, location LED, and system error LED.
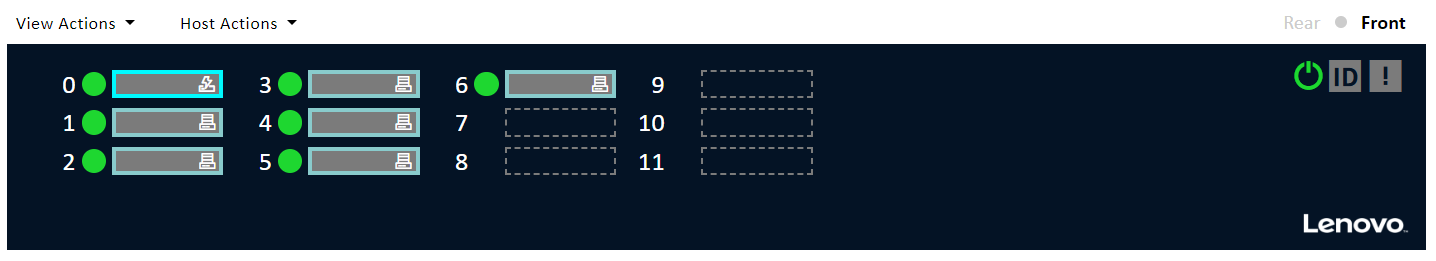
- Disk location: displays the serial number of the slot where a disk is located. A slot without any disk installed will be shown as
 .
. - Disk status: Different colors represent different disk states.
- Green: normal
- Yellow: warning
- Red: critical
- Disk type: displays the usage status of a disk in vSAN, which can be
 cache disk,
  capacity disk,
  unclaimed disk,
  vSAN direct disk, and
  unqualified disk.
 - Disk group information: Click a disk on the topology. If the disk belongs to a vSAN disk group, other disks in the same vSAN disk group will be highlighted with a solid blue line.
- Disk location: displays the serial number of the slot where a disk is located. A slot without any disk installed will be shown as
Middle panel
Provide a virtual view of disks installed in the server's internal panel slots.
Rear panel
Provide a virtual view of disks and power supply modules installed in the server's rear panel slots.

- Power module: Different colors represent different operating states of power supply modules.
- Red: critical
- Dashed line: empty
- Green: normal
- Yellow: warning
- Power module: Different colors represent different operating states of power supply modules.
Viewing disk details
- The disk list below the topology diagram will list detailed information about physical and logical disks, including Slot, Type, Model, Controller, Status, Capacity, Media and Health Status. Click Go to the hardware alert log page to view more health status information.
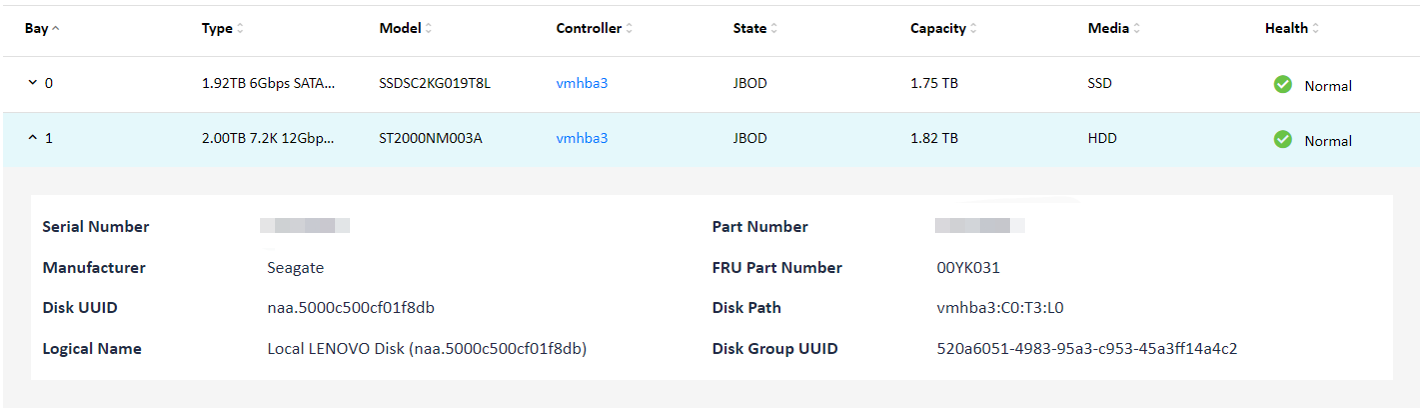
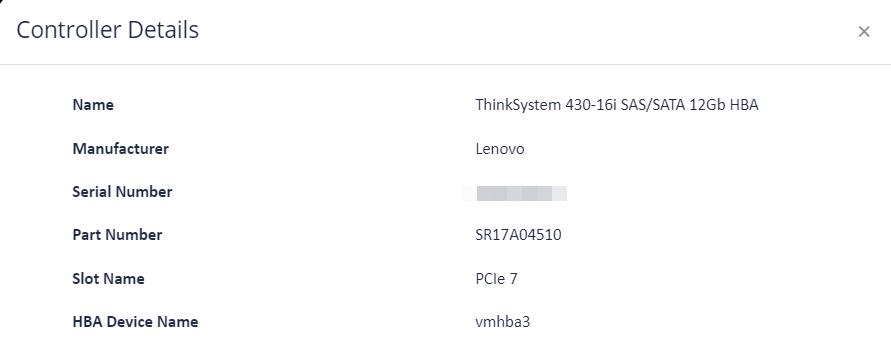
- Click a controller name to view controller details.
View operations
Click the View operations drop-down box to perform the following operations:
- Refresh the hardware topology: updates hardware topology information.
- Show disk icon legends: displays disk icons in the topology view to represent different disk types, including cache disk, capacity disk, unclaimed disk, vSAN direct disk, unqualified disk, and empty slot. To hide the icon legends, click the button again.
- Show disk groups: displays disk groups on disks in the topology view. To hide disk groups, click the button again.
Host operations
Click the Host operations drop-down box to perform the following operations:
- **Host LED**: On: Turn on the host LED.
- **Host LED**: Off: Turn off the host LED.
- **Host LED**: Blink: Make the host LED blink.