Using CentOS with FIO marketplace template to determine latency
You can use the CentOS with FIO template from the Lenovo Cloud Marketplace to determine latency.
The recommended test to run is a direct I/O test, which means I/O access where you bypass the cache (as buffered I/O can be misleading).
You need to stop the automatic FIO that is running and manually run it.
- Download the Centos with FIO template from the Lenovo Cloud Marketplace and create an application instance from the template.
For more information about creating an application instance from a template, see the following topic:
- Connect to your application instance.
- In the left navigation of the ThinkAgile CP Cloud Controller, expand your VDC.
- Click VDC Instances.
- Click the Actions menu (
 ) for your application instance.
 - Click Connect to console.
The test will look similar to the following example. In this example, you can see the same information provided on the activity page, including in depth details of your environment.
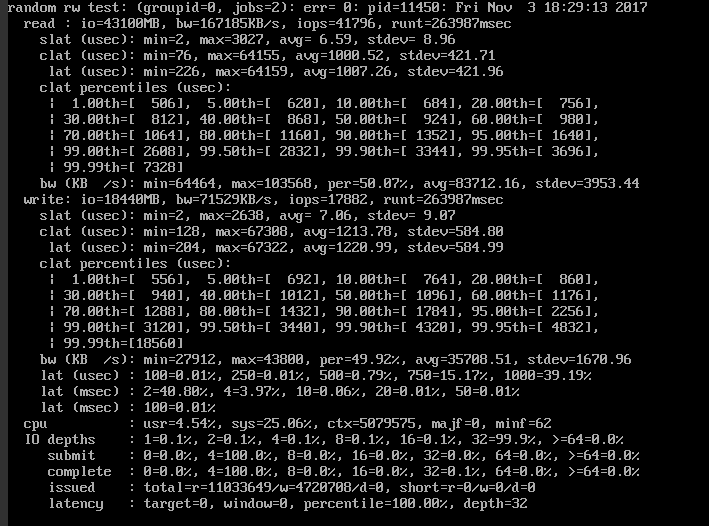
Read and Write. The first line of the 'read' or 'write' sections state the I/O requests, bandwidth, iops, and run time that occurred within the duration of the test. In the above example, fio did a total of 43GB of IO at 167.2MB/s for a total of 41796 IOPS, and ran for 4 minutes and 39 seconds.
slat (or submission latency, measured in usec). The amount of time that it took to submit this I/O to the kernel for processing
clat (or completion latency, measured in usec). The amount of time between request submission and request completion.
lat (or latency distribution, measured in usec). The amount of time that it took for a certain percentage of I/O requests to complete. In the above example, 0.01% of requests took 100 microseconds, 0.01% of requests took 250 microseconds, 0.79% of requests took 500 microseconds, and so on.
I/O depths. The amount of I/O depths reached at what percentage of the time.
Submit and complete. The number of submitted IOs at a time by fio and the number completed at a time.