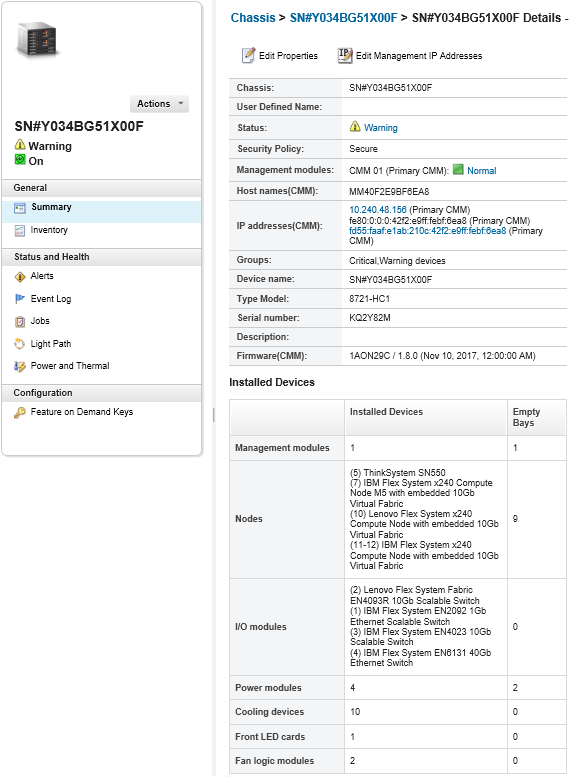
Viewing the details of a managed chassis
You can view the detailed information about the managed chassis from Lenovo XClarity Administrator, including the firmware levels, IP addresses, and universally unique identifier (UUID).
About this task
The system-level air temperature is measured by a physical sensor at the front of the server. This temperature represents inlet air temperature for the server. Note that the air temperature that is reported by XClarity Administrator and the CMM might differ if the temperature is captured at different points in time.
Procedure
Complete the following steps to view the details for a managed chassis.
After you finish
- View a chassis in graphical rack or chassis view by clicking or .
- Launch the CMM web interface by clicking the IP address link (see Launching the CMM web interface for a chassis).
- Modify information (such as support contact, location and description) by clicking Edit Properties (see Modifying the system properties for a chassis).
- Modify the management IP settings for the entire chassis, including compute nodes and Flex switches, by clicking (see Modifying the management-IP settings for a chassis).
- Export detailed information about the chassis to a CSV file clicking the .Note
For more information about inventory data in the CSV file, see the GET /chassis/<UUID_list>.
When importing a CSV file into Microsoft Excel, Excel treats text values that contain only numbers as numeric values (for example, for UUIDs). Format each cell as text to correct this error.
- Unmanage a chassis (see Unmanaging a chassis).
Enable or disable firewall rule changes on a chassis that limit incoming requests only from XClarity Administrator by selecting the chassis and clicking or .
The global encapsulation setting is disabled by default. When disabled, the device encapsulation mode is set to
normal
and the firewall rules are not changed as part of the management process.The global encapsulation setting is disabled by default. When disabled, the device encapsulation mode is set to
normal
and the firewall rules are not changed as part of the management process.When the global encapsulation setting is enabled and the device supports encapsulation, XClarity Administrator communicates with the device during the management process to change the device encapsulation mode to
encapsulationLite
and to change the firewall rules on the device to limit incoming requests to those only from XClarity Administrator.AttentionIf encapsulation is enabled andXClarity Administrator becomes unavailable before a device is unmanaged, necessary steps must be taken to disable encapsulation to establish communication with the device. For recovery procedures, see lenovoMgrAlert.mib file and Recovering management with a CMM after a management server failure. - Resolve issues that might arise between the XClarity Administrator security certificate and the security certificate of the CMM in the chassis by selecting a chassis and clicking (see Resolving an untrusted server certificate).

